在因子变量的条形图上添加括号(geom_bar,geom_bracket)
在因子变量的条形图上添加括号(geom_bar,geom_bracket)
提问于 2022-10-05 00:00:05
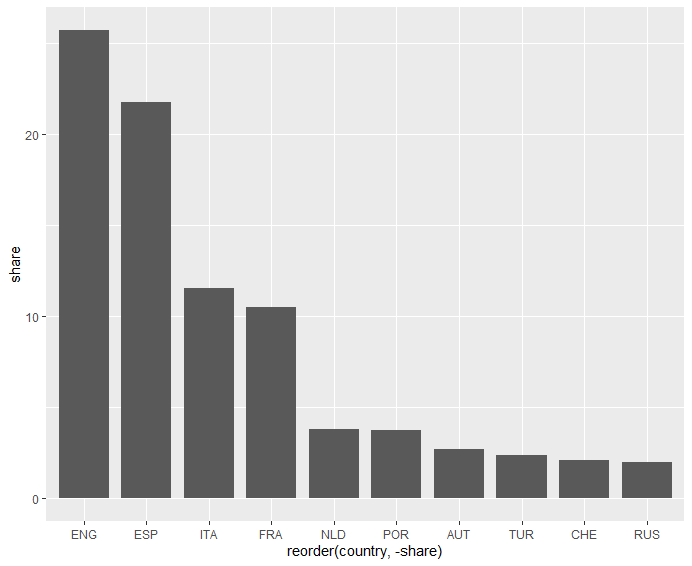
我试图使用geom_bracket来注释有序分类栏的条形图。
示例数据和绘图:
df <- tibble(
  country= c("ENG","ESP", "ITA", "FRA", "NLD", "POR", "AUT", "TUR", "CHE", "RUS"),
  share=c(25.71, 21.74, 11.54, 10.49,  3.76,  3.73,  2.67,  2.34,  2.07,  1.97)
)

df %>%
  ggplot() +
  geom_bar(aes(x = reorder(country, -share), y = share), stat = "identity", width = 0.8, position = "dodge")
我与geom_bracket一起玩,将条形图分组(例如,前四条(ENG到FRA)为“前4位”),但无法让它正常工作,经常会遇到以下错误消息:
Error in data.frame(label = label, y.position = y.position, xmin = xmin,  :
  arguments imply differing number of rows: 0, 1
我如何添加一个水平括号浮动以上的酒吧(在y=30)?
回答 2
Stack Overflow用户
回答已采纳
发布于 2022-10-05 00:16:38
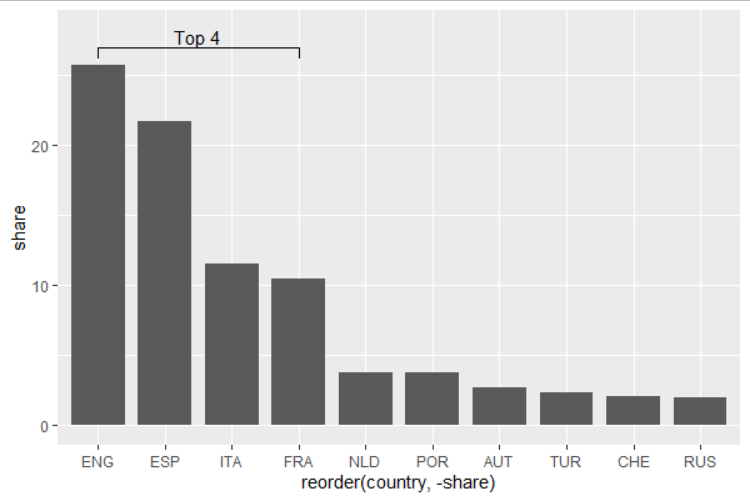
试试这个:
ggplot(df, aes(x = reorder(country, -share), y = share)) +
  geom_bar(stat = "identity", width = 0.8, position = "dodge") +
  #add bracket
  geom_bracket(xmin = 1, xmax = 4,
               y.position = max(df$share) * 1.05,
               label = "Top 4") +
  #extend y-axis to show text on bracket
  ylim(0, max(df$share) * 1.1)
Stack Overflow用户
发布于 2022-10-05 00:12:15
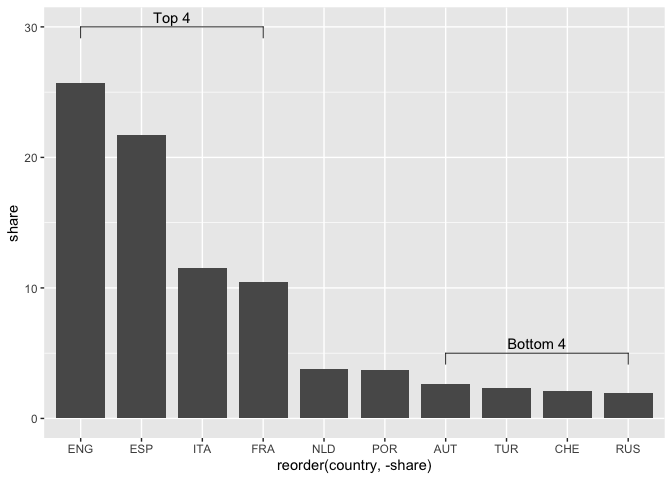
为了达到您想要的结果,您可以创建一个包含数字xmin和xmax位置的数据框架,在这些位置您需要绘制方括号和label。此外,您还必须通过y.position传递括号的y位置。
library(ggplot2)
library(ggpubr)

ggplot(df) +
  geom_col(aes(x = reorder(country, -share), y = share), width = 0.8, position = "dodge") +
  geom_bracket(
    aes(xmin = xmin, xmax = xmax, label = label),
    data = data.frame(xmin = c(1, 7), xmax = c(4, 10), label = c("Top 4", "Bottom 4")), y.position = c(30, 5)
  )
页面原文内容由Stack Overflow提供。腾讯云小微IT领域专用引擎提供翻译支持
原文链接:
https://stackoverflow.com/questions/73957393
复制


相似问题
如何在条形图上标注geom_bar?
如何使用因子变量作为轴之一在图上添加颜色?
在python中将值添加到条形图上的条形图上方
当变量是因子时,geom_bar会改变行为
两个geom_bar()与因子变量的错误阶
添加站长 进交流群
领取专属 10元无门槛券
AI混元助手 在线答疑

关注 腾讯云开发者公众号
洞察 腾讯核心技术
剖析业界实践案例

腾讯云开发者
