在牛尾分层图中添加脚注
在牛尾分层图中添加脚注
提问于 2022-08-17 13:37:17
我正在用劳工统计局的数据制作一个分层图表,而且由于我要发布图表,我需要引用数据源。我需要在图表的底部加上一行,上面写着“资料来源:劳工统计局。截止2022年7月的数据。”我可以添加标题和副标题,但似乎没有脚注/源行的选项。有什么解决办法吗?
import pandas as pd
import pandas_datareader.data as pdr
import datetime
import altair as alt

start = datetime.datetime (2020, 1, 1)
end = datetime.datetime (2022, 7, 10)

df = pdr.DataReader('UNRATE', 'fred', start, end)
df = df.rename(columns={'UNRATE':'Unemployment Rate'})
df["Date"] = df.index
df['Prepandemic Rate'] = 3.5

source = df

line = (
    alt.Chart(source)
    .mark_line(point=False, strokeWidth=2, color='blue')
    .encode(x="Date", y="Unemployment Rate")
)

line2 = (
    alt.Chart(source)
    .mark_line(point=False, strokeWidth=2, color='red')
    .encode(x="Date", y="Prepandemic Rate")
)

alt.layer(line, line2).properties(
    width=300, height=300, title={
    "text":'Unemployment Rate',
    "subtitle":['Seasonally adjusted']
    },
).configure_title(
  anchor= 'start'
)注意:我看到了这个问题(How to add a Text Footer to an Altair graph?),但我似乎无法在分层图表上使用concat函数。
回答 2
Stack Overflow用户
回答已采纳
发布于 2022-08-18 02:06:16
页脚到刻面图,您可以将其作为TitleParams添加到最终图表中。你仍然需要使用字体大小并根据你的喜好平衡图表)。
至于您的进一步请求-我更新了代码以适应所有(标题、字幕、页脚),我使用了this post的@jakevdp
我认为这种方法使->更容易创建标题+微妙的单独图表,在原始图表中添加页脚,并将它们连接起来。
你仍然需要在对齐,你的图例的位置,字体,等等。
或作为另一种方法-使用标题和副标题的标题参数,以及连接脚注。
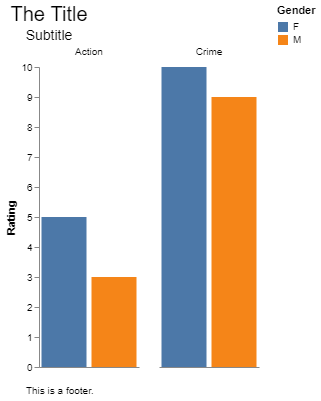
df = pd.DataFrame([['Action', 5, 'F'],
                   ['Crime', 10, 'F'],
                   ['Action', 3, 'M'],
                   ['Crime', 9, 'M']],
                  columns=['Genre', 'Rating', 'Gender'])

chart = alt.Chart(df).mark_bar().encode(
   column=alt.Column(
       'Genre', title=""),
   x=alt.X('Gender', axis=alt.Axis(ticks=False, labels=False, title='')),
   y=alt.Y('Rating', axis=alt.Axis(grid=False)),
   color='Gender'

).properties(width=100, title=alt.TitleParams(
        ['This is a footer.'],
        baseline='bottom',
        orient='bottom',
        anchor='start',
        fontWeight='normal',
        fontSize=10,
        dy=20, dx=20
    ))


title = alt.Chart(
    {"values": [{"text": "The Title"}]}
).mark_text(size=20).encode(
    text="text:N"
)

subtitle = alt.Chart(
    {"values": [{"text": "Subtitle"}]}
).mark_text(size=14).encode(
    text="text:N"
)


alt.vconcat(
    title,
    subtitle,
    chart
).configure_view(
    stroke=None
).configure_concat(
    spacing=1)
Stack Overflow用户
发布于 2022-08-17 14:44:59
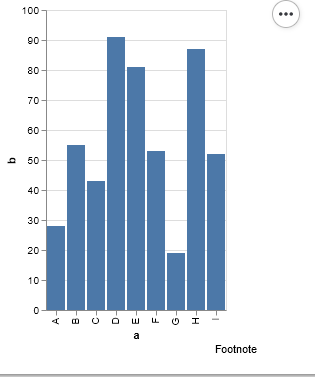
你可以在任何你喜欢的地方添加任何文本。例如。
import altair as alt
import pandas as pd

source = pd.DataFrame({
    'a': ['A', 'B', 'C', 'D', 'E', 'F', 'G', 'H', 'I'],
    'b': [28, 55, 43, 91, 81, 53, 19, 87, 52]
})

data = alt.Data(values=[{'x': 'A'}])

text1 = (
    alt.Chart(data)
    .mark_text(text='Footnote', x='width', y='height', dx = 10, dy=40)

)

bar1 = alt.Chart(source).mark_bar().encode(
    x='a',
    y='b',

)
alt.layer(text1, bar1)
页面原文内容由Stack Overflow提供。腾讯云小微IT领域专用引擎提供翻译支持
原文链接:
https://stackoverflow.com/questions/73395174
复制


![在DevOps中分层安全性[DevOps]](https://ask.qcloudimg.com/http-save/6790159/fi8xxoej13.png)


相似问题
在牛尾图层图中添加图例
在牛尾图中改变单色
用牛尾标注分层图表(Python)
如何将数学符号添加到牛尾图中?
无法在回收器视图中动态添加脚注项
添加站长 进交流群
领取专属 10元无门槛券
AI混元助手 在线答疑

关注 腾讯云开发者公众号
洞察 腾讯核心技术
剖析业界实践案例

腾讯云开发者

