biotrainee note 5
原创

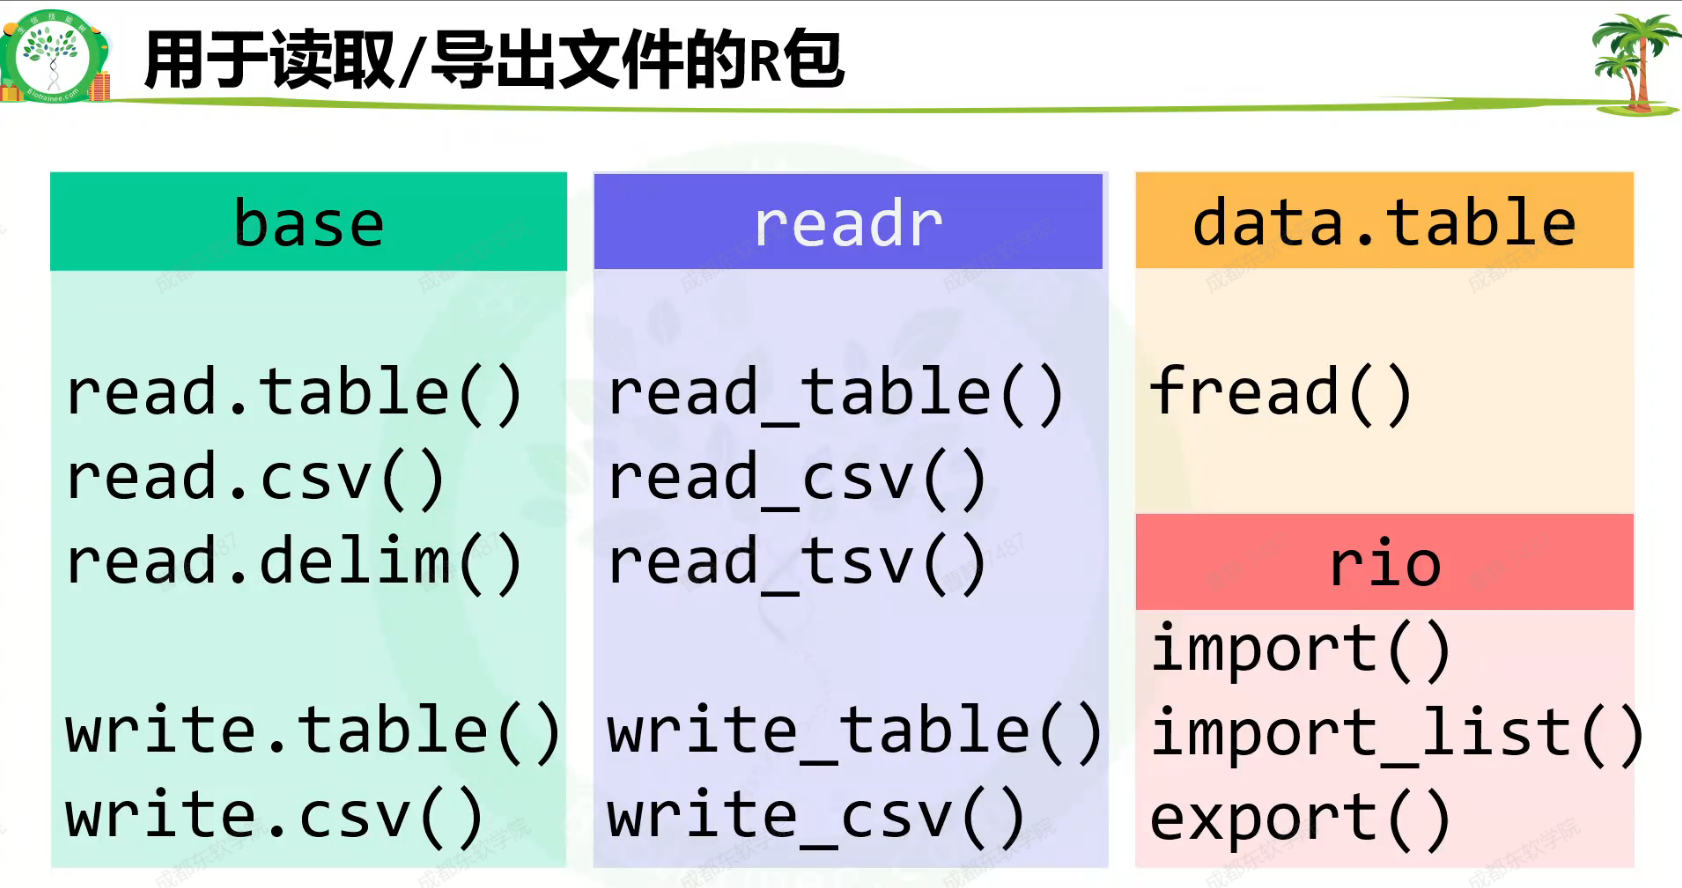
用于读取/导出文件的R包
如果需要设置行名或者不修改列明,需要用到base包,只有它有参数可以设置
反之,则用其他两个包,读取速度会比较快
rio包最好用
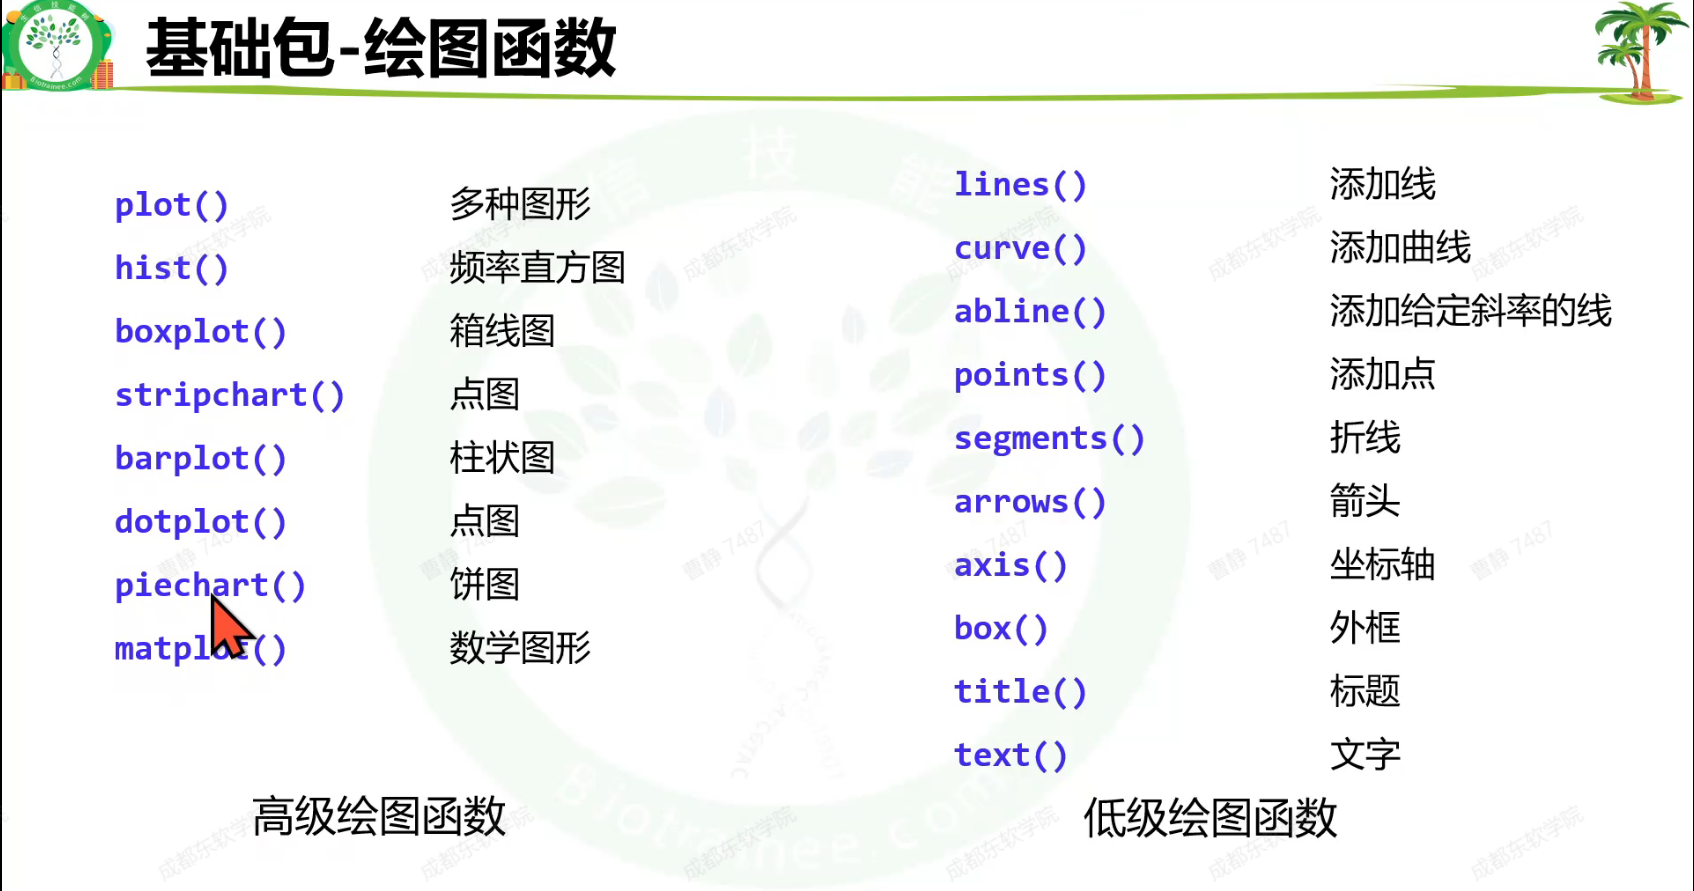
基础包-绘图函数
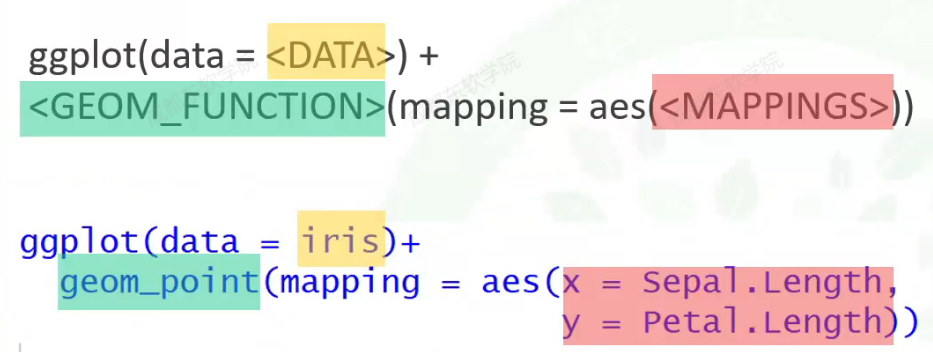
ggplot2画图
列明不带引号,函数之间写加号
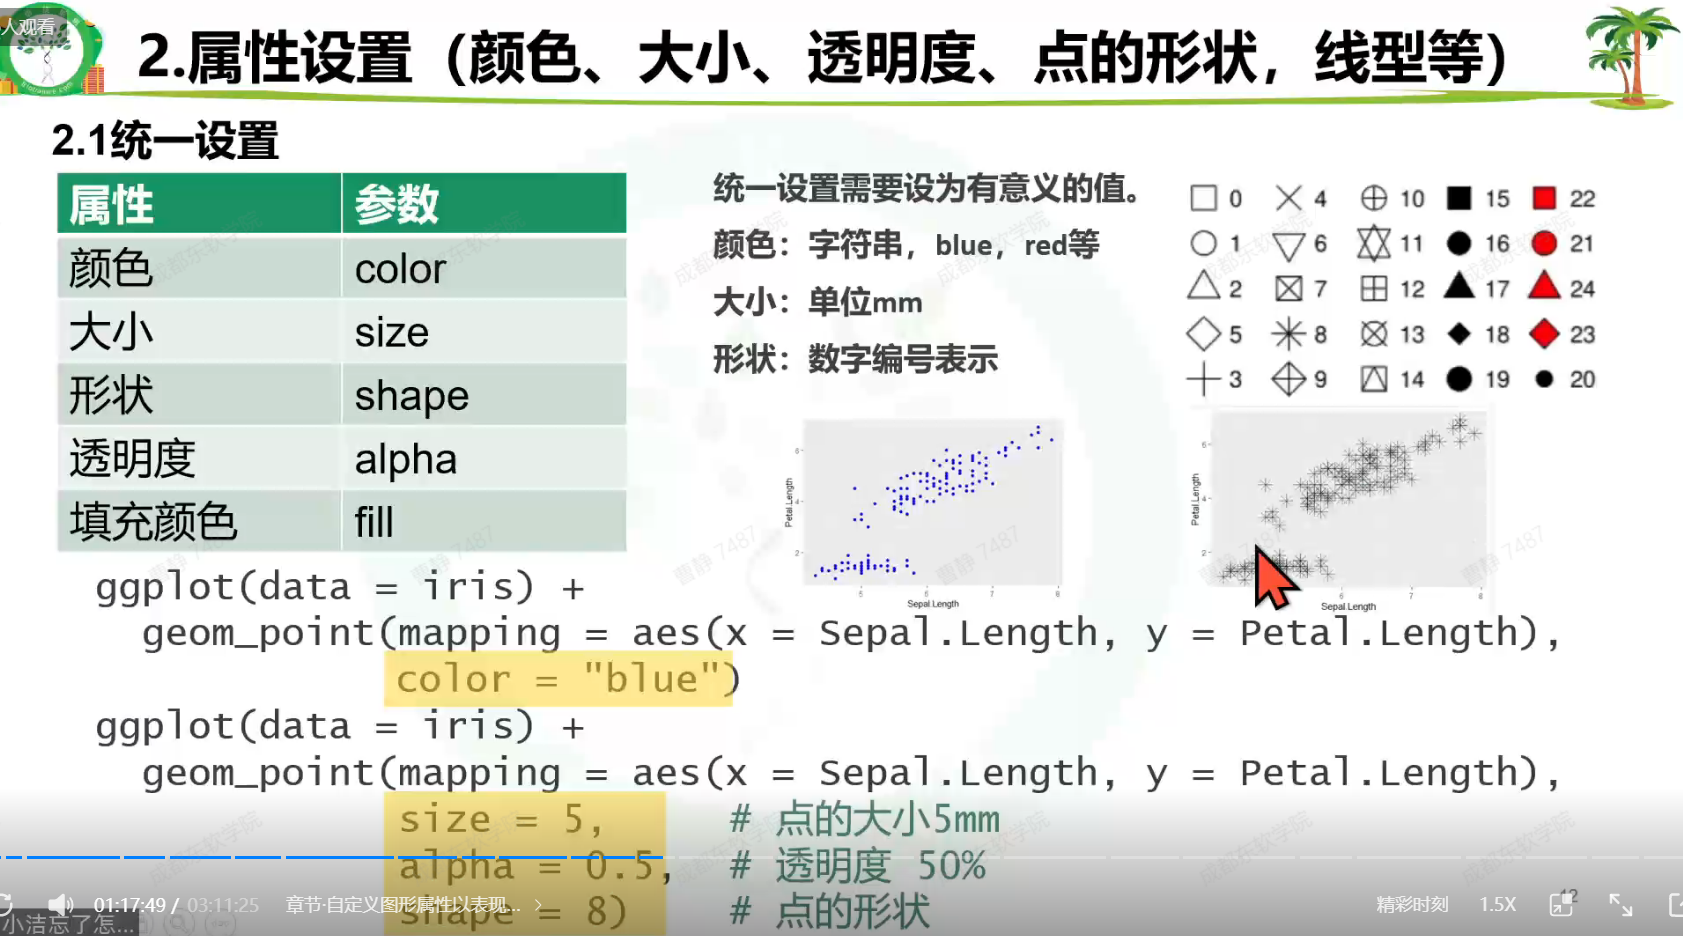
属性设置
映射
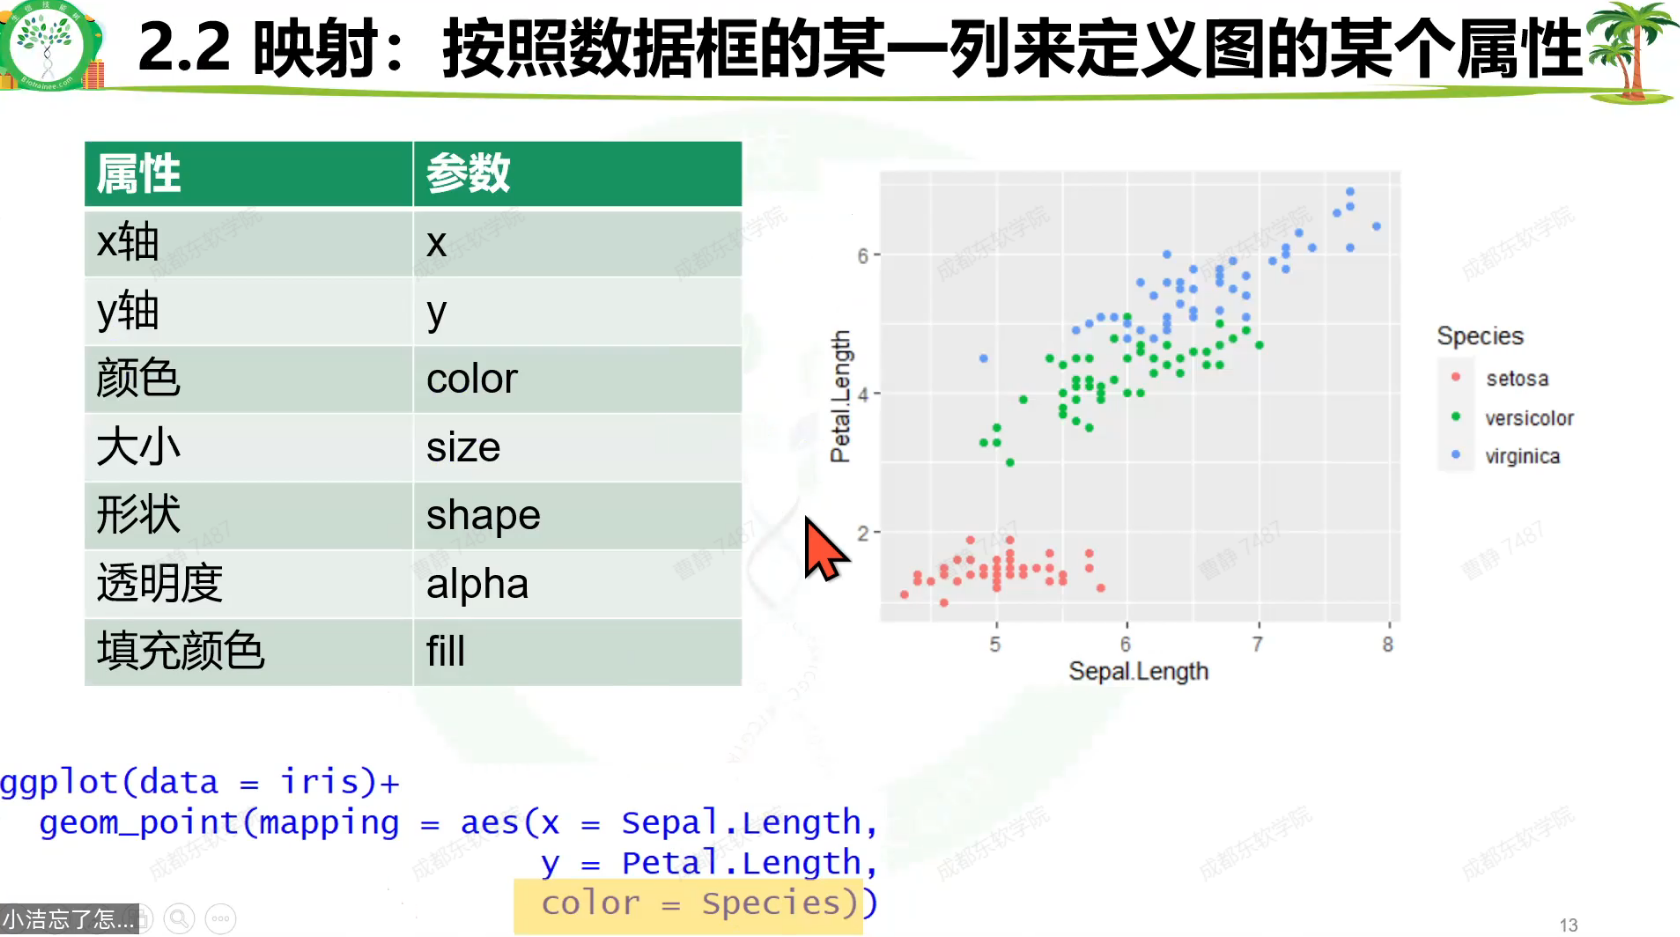
映射与统一设置的区别

自行指定映射的颜色
ggplot(data = iris)+
  geom_point(mapping = aes(x = Sepal.Length,
                           y = Petal.Length,
                           color = Species))+
  scale_color_manual(values = c("blue","grey","red"))
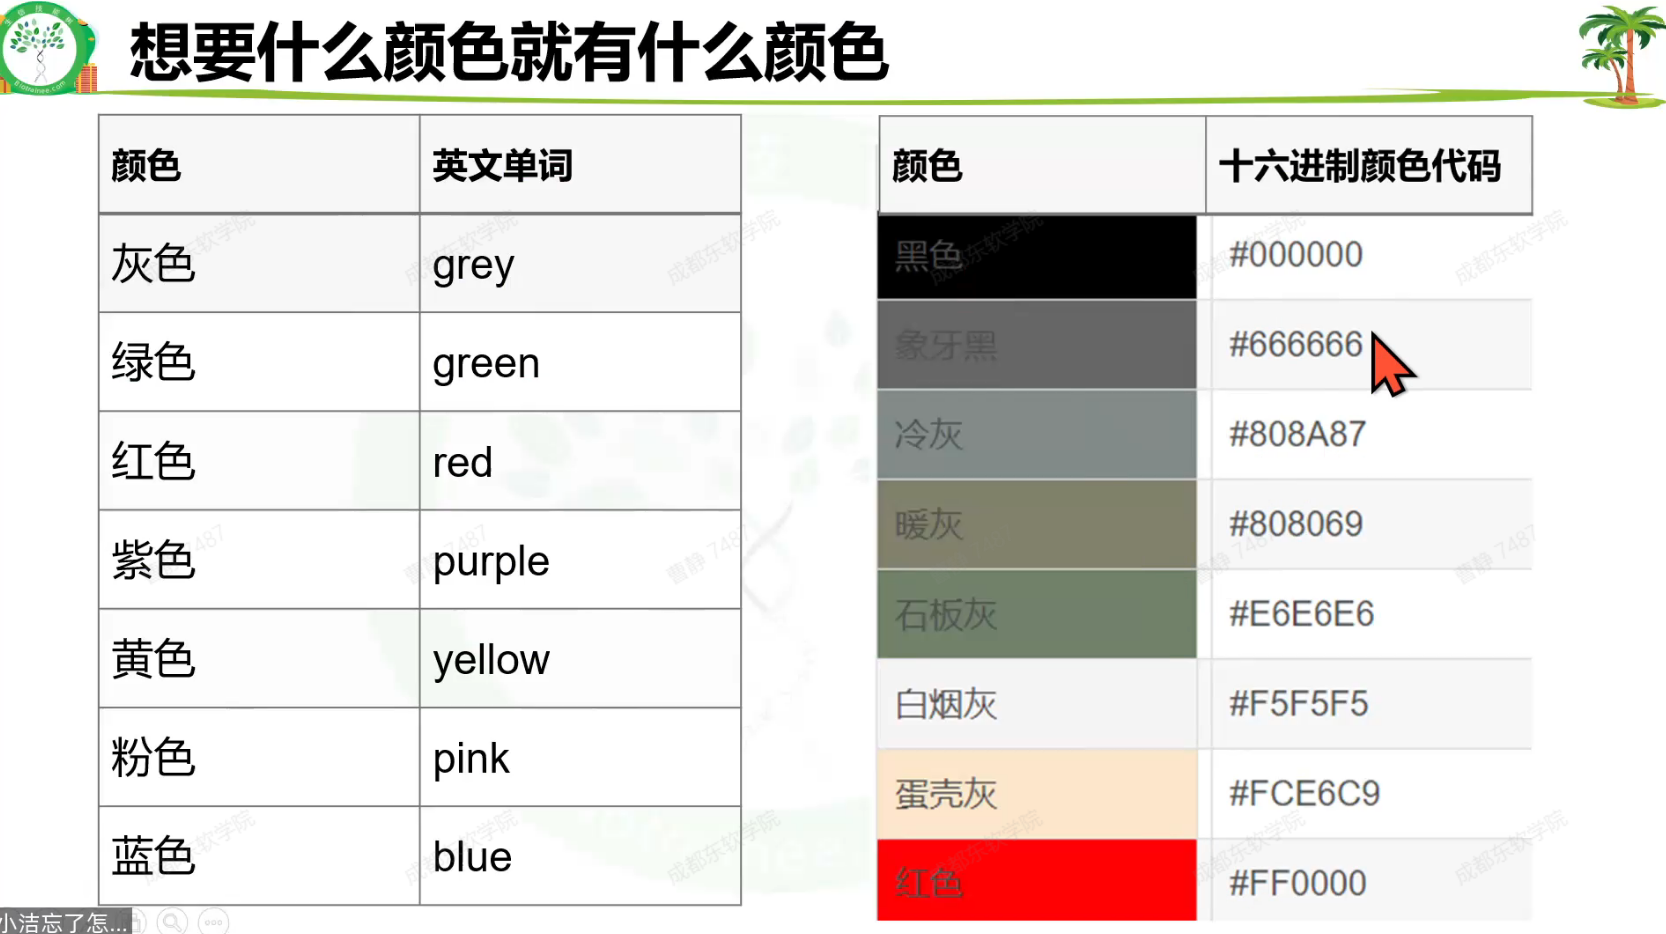
想要什么颜色就有什么颜色
按照颜色的十六进制代码
ggplot(data = iris)+
  geom_point(mapping = aes(x = Sepal.Length,
                           y = Petal.Length,
                           color = Species))+
  scale_color_manual(values = c("#2874C5","#e6b707","#f87669"))
用别人的配色风格来给自己的图配色-用paletteer来举例
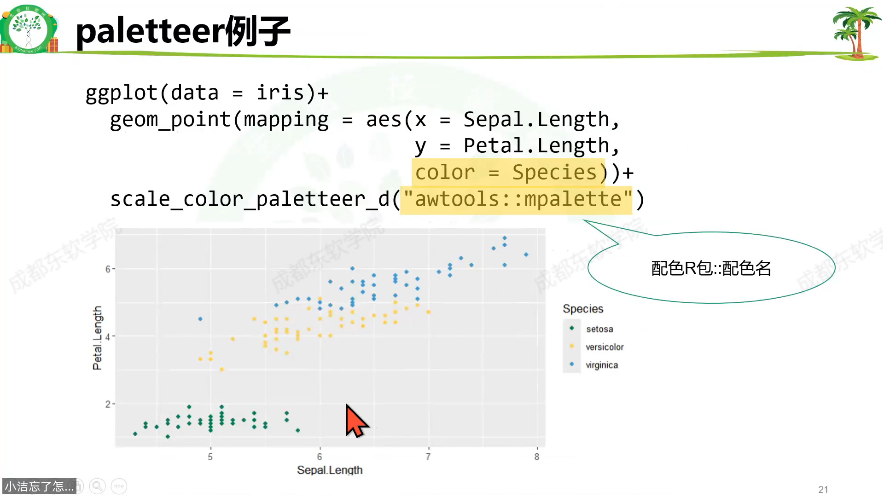
ggplot(data = iris)+
  geom_point(mapping = aes(x = Sepal.Length,
                           y = Petal.Length,
                           color = Species))+
  scale_color_paletteer_d("awtools::mpalette")
绘制箱线图
ggplot(data = iris,mapping = aes(x = Species,
                                 y = Sepal.Width,
                                 fill = Species))+
  geom_boxplot()
让点抖动起来
ggplot(data = iris,mapping = aes(x = Species,
y = Sepal.Width,
fill = Species))+
geom_boxplot()+
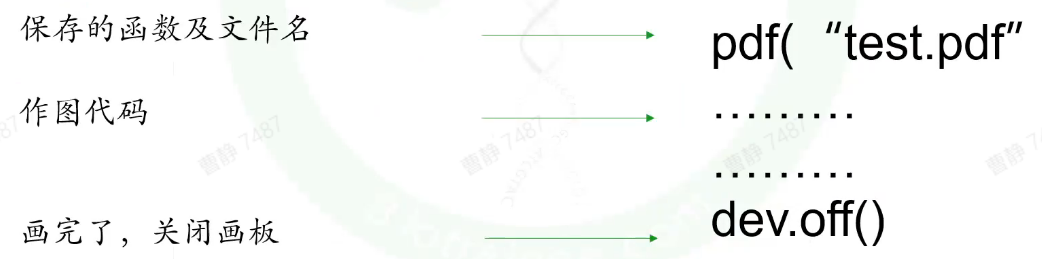
geom_jitter()图片保存
#2.ggplot系列图(包括ggpubr)通用的简便保存 ggsave
p <- ggboxplot(iris, x = "Species",
               y = "Sepal.Length",
               color = "Species",
               shape = "Species",
               add = "jitter")
ggsave(p,filename = "iris_box_ggpubr.png")
还可以用通用的方法
保存为PPT格式
#eoffice包 导出为ppt,全部元素都是可编辑模式
library(eoffice)
topptx(p,"iris_box_ggpubr.pptx")
拼图

现成的画图代码
画图的正确思维
1、我的数据适合用什么图展示?多看文献
2、搜画图代码
代码可复制,图片美观
提供了代码的示例数据
示例代码+示例数据√
3、仿制示例数据
数据类型、数据结构相同
组织方式、对应关系
4、套代码、调细节
小工具分享
1、浏览器插件:沉浸式翻译,推荐使用微软edge的浏览器
2、AI工具monica,要收费
原创声明:本文系作者授权腾讯云开发者社区发表,未经许可,不得转载。
如有侵权,请联系 cloudcommunity@tencent.com 删除。
原创声明:本文系作者授权腾讯云开发者社区发表,未经许可,不得转载。
如有侵权,请联系 cloudcommunity@tencent.com 删除。
评论
登录后参与评论
推荐阅读
目录
腾讯云开发者

Copyright © 2013 - 2026 Tencent Cloud. All Rights Reserved. 腾讯云 版权所有
深圳市腾讯计算机系统有限公司 ICP备案/许可证号:粤B2-20090059 ![]() 粤公网安备44030502008569号
粤公网安备44030502008569号
腾讯云计算(北京)有限责任公司 京ICP证150476号 | 京ICP备11018762号