基于matplotlib的毫米波动画
基于matplotlib的毫米波动画
提问于 2021-01-07 22:51:08
我试图建立一个微波旅行和改变频率,因为他们旅行模拟。X轴是时间,波应该沿着x轴移动,然后改变频率(从3 3GHz到30 3GHz)。时间间隔是1纳秒,因为比这更高的时间间隔太快,无法清楚地注意到运动。
我已经创建了一个波浪matplotlib.pyplot的静态模型。现在,我想使用matplotlib.animation来动画它。通过遵循这个文章中的指南,我可以成功地创建一个正弦波动画,但是我不知道从那里到哪里。
如何利用绘制正弦波的matplotlib.animation示例代码并将其调整为动画微波?
微波模型:
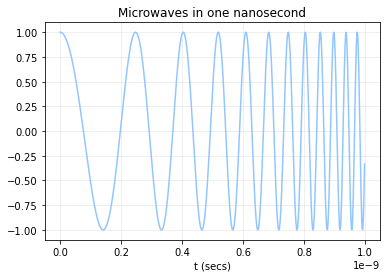
用于绘制微波模型的代码:
import numpy as np
from scipy.signal import chirp
import matplotlib.pyplot as plt
plt.style.use('seaborn-pastel')

T = 0.000000001 #one nanosecond
n = 1000 # number of samples to generate - the more generated,the more smooth the curve
t = np.linspace(0, T, n, endpoint=False) # x-axis
f0_micro = 3000000000 #frequency min value: 3GHz
f1_micro = 30000000000 #frequency max value: 30GHz
y_micro = chirp(t, f0_micro, T, f1_micro, method='logarithmic')

plt.plot(t,y_micro)
plt.grid(alpha=0.25)
plt.xlabel('t (secs)')
plt.title('Microwaves in one nanosecond')
plt.show()
动画正弦波视频:
用于绘制动画正弦波的代码:
import numpy as np
from matplotlib import pyplot as plt
from matplotlib.animation import FuncAnimation
plt.style.use('seaborn-pastel')


fig = plt.figure()
ax = plt.axes(xlim=(0, 4), ylim=(-2, 2))
line, = ax.plot([], [], lw=3)

def init():
    line.set_data([], [])
    return line,
def animate(i):
    x = np.linspace(0, 4, 1000)
    y = np.sin(2 * np.pi * (x - 0.01 * i))
    line.set_data(x, y)
    return line,

anim = FuncAnimation(fig, animate, init_func=init,
                               frames=200, interval=20, blit=True)


anim.save('sine_wave.gif', writer='imagemagick')回答 2
Stack Overflow用户
回答已采纳
发布于 2021-01-08 00:03:51
对于这种类型的动画
而不是画出所有的点
plt.plot(t, y_micro) # <--- skip it你必须创建一个空的地块--有正确的限制
fig = plt.figure()

ax = plt.axes(xlim=(t[0], t[-1]), ylim=(min(y_micro), max(y_micro)))

line, = ax.plot([], [], lw=3)在animation的后面,您可以使用i只放置部分点。
line.set_data(t[:i], y_micro[:i])import numpy as np
from scipy.signal import chirp
import matplotlib.pyplot as plt
from matplotlib.animation import FuncAnimation
plt.style.use('seaborn-pastel')
# --- generate all data without drawing ---
T = 0.000000001 #one nanosecond
n = 1000 # number of samples to generate - the more generated,the more smooth the curve
t = np.linspace(0, T, n, endpoint=False) # x-axis
f0_micro = 3000000000 #frequency min value: 3GHz
f1_micro = 30000000000 #frequency max value: 30GHz
y_micro = chirp(t, f0_micro, T, f1_micro, method='logarithmic')
# --- create empty plot ---
#plt.plot(t,y_micro) # <--- skip it
fig = plt.figure()
ax = plt.axes(xlim=(t[0], t[-1]), ylim=(min(y_micro), max(y_micro)))
line, = ax.plot([], [], lw=3)
# --- other elements on plot ---
plt.grid(alpha=0.25)
plt.xlabel('t (secs)')
plt.title('Microwaves in one nanosecond')
# --- animate it ----
def init():
# put empty data at start
line.set_data([], [])
return line,
def animate(i):
# put new data in every frame using `i`
line.set_data(t[:i], y_micro[:i])
return line,
# calculate how many frames has animation
frames_number = len(t)
anim = FuncAnimation(fig, animate, init_func=init, frames=frames_number, interval=10, blit=True)
plt.show()
# I use `fps` (frames per second) to make it faster in file
anim.save('microwave.gif', fps=120) #, writer='imagemagick')编辑
如果您需要带边距的绘图,那么您必须向限制中添加一些值,因为现在绘图不会自动添加边距。
x_margin = T/30  # I tested manually different values
y_margin = 0.1   # I tested manually different values

x_limits = (t[0] - x_margin, t[-1] + x_margin)
y_limits = (min(y_micro) - y_margin, max(y_micro) + y_margin)

fig = plt.figure()
ax = plt.axes(xlim=x_limits, ylim=y_limits)
line, = ax.plot([], [], lw=3)如果您想要更快的动画在文件中,那么您可以尝试使用save( ..., fps= ...)对数量的frames per second。
或者你可以画更少的画框
frames_number = len(t) // 2并在每一帧中显示更多的点
i = i*2
line.set_data(t[:i], y_micro[:i])Stack Overflow用户
发布于 2021-01-08 00:45:07
一种新的和稍微容易使用的替代matplotlib.animate的方法是赛洛普。
import numpy as np
import matplotlib.pyplot as plt
from scipy.signal import chirp
from celluloid import Camera

fig = plt.figure()
camera = Camera(fig)

T = 0.000000001 #one nanosecond
n = 1000 # number of samples to generate - the more generated,the more smooth the curve
t = np.linspace(0, T, n, endpoint=False) # x-axis
f0_micro = 3000000000 #frequency min value: 3GHz
f1_micro = 30000000000 #frequency max value: 30GHz
y_micro = chirp(t, f0_micro, T, f1_micro, method='logarithmic')

for i in range(len(t)):

    plt.plot(t[:i], y_micro[:i], "r")
    camera.snap()

    plt.grid(alpha=0.25)
    plt.xlabel('t (secs)')
    plt.title('Microwaves in one nanosecond')

animation = camera.animate(interval=10)
plt.show()
它可以做您想做的事情,只需对静态图的代码进行很少的修改。您不需要定义额外的功能等等。
最终结果如下
页面原文内容由Stack Overflow提供。腾讯云小微IT领域专用引擎提供翻译支持
原文链接:
https://stackoverflow.com/questions/65624585
复制相关文章


相似问题
使用随机值填充c#对象
如何使用JSON的值填充现有的对象实例
如何使用随机值填充Postgre列
如何使用随机对象元素填充<ul>?
使用循环使用随机值填充树
腾讯云开发者
