将点添加到英国地方当局的合唱图中
将点添加到英国地方当局的合唱图中
提问于 2021-11-12 04:43:42
我在R中绘制了一张合唱图,它根据处于燃料贫困家庭的比例,使地方当局黯然失色。
#converts file into a readable format
options(scipen = 999)

#create a data frame from imported CSV file
mydata <- readr::read_csv("/Users/Desktop/R/Map/Fuel_Poverty.csv")

#import shape file
mymap <-st_read("Local_Authority_Districts__December_2019__Boundaries_UK_BUC.shp", stringsAsFactors = FALSE)

#joins map shape file to local authority data csv
map_and_data <- inner_join(mymap,mydata)

#displays structure of object
str(map_and_data)

#creates a plot
ggplot(map_and_data) +
  geom_sf(aes(fill = Fuel_Poverty_Percentage),lwd = 0.1) +
  theme_void() +
  scale_fill_gradient2(low = "#a50026", high = "#005abb", midpoint = 170, na.value = "#808080")
现在我想在一些点上进行分层,这些点将对应于特定的位置,可能以后成本或纬度和经度值的形式出现。我尝试了几个教程,但似乎只是得到点出现在左下角,无论我设置的经度和纬度值?
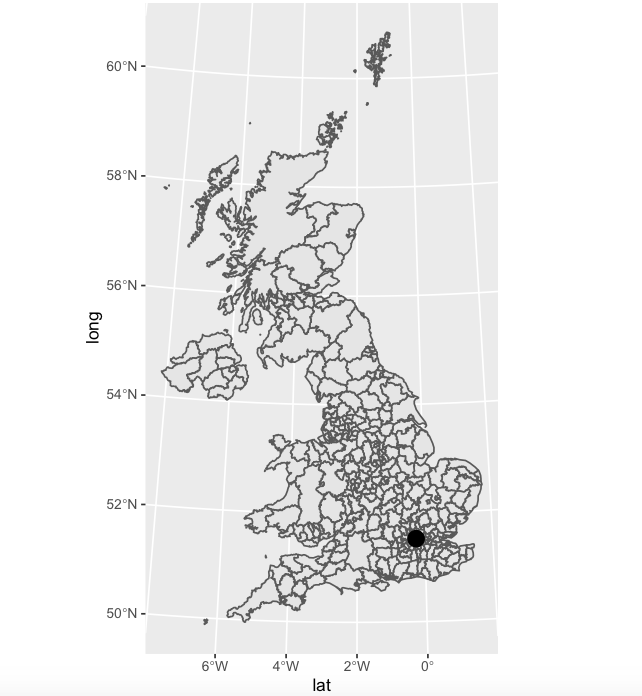
(sites <- data.frame(lat = c(54.7), long = c(-1.27)))

#creates a plot
ggplot(map_and_data) +
  geom_sf(aes(fill = Fuel_Poverty),lwd = 0.1) +  # lwd = 0.1 is line thickness, 1.5 @5000 pixels to save well
  geom_point(data = sites, aes(x = long, y = lat), size = 3, shape = 21, fill = "red") +
  theme_void() +     #this takes out the background
scale_fill_gradient2(low = "#005abb", high = "#a50026", midpoint = 12, na.value = "#808080")回答 1
Stack Overflow用户
回答已采纳
发布于 2021-11-12 07:10:51
由于您的地图数据mymap是在(坐标参考系统) OSGB 1936 /英国国家网格格式,任何点的全球定位系统(纬度,经度)格式必须翻译。
例如,伦敦51.52756,-0.257844 (GPS WGS84坐标)中的一个点转换为520948.75443717,182398.33790064 (使用OSTN15转换的OSGB36网格参考)。
- 使用您的绘图中的数据:
mypoint <- data.frame(lat=520948.75443717,long=182398.33790064)

ggplot() +
 geom_sf( data=mymap ) +
 geom_point( data=mypoint, aes(lat, long, size=200) )
页面原文内容由Stack Overflow提供。腾讯云小微IT领域专用引擎提供翻译支持
原文链接:
https://stackoverflow.com/questions/69943144
复制相关文章

![[答疑]业务序列图中执行者的地方是组织还是员工](https://ask.qcloudimg.com/http-save/yehe-6288414/su757v2yog.jpeg)


相似问题
如何利用GeoJSON与英国地方当局绘制一幅真实的合唱图
如何在英国境内找到地方当局的具体最大和最小坐标?
使用Altair显示英国合唱图时的问题
将点添加到in图中的堆栈线图中
将点添加到OSMnx图中
添加站长 进交流群
领取专属 10元无门槛券
AI混元助手 在线答疑

关注 腾讯云开发者公众号
洞察 腾讯核心技术
剖析业界实践案例

腾讯云开发者
