
plotly.py:更改行不透明度,留下标记不透明
是否可以改变线不透明度,但不改变标记不透明度?我发现我可以设置整个行的不透明度,包括标记(opacity = .5)和标记(例如,marker={"opacity":1})。
如本例所示:
import plotly
import plotly.graph_objs as go
plotly.offline.init_notebook_mode(connected=True)  # I'm running in a jupyter notebook

x = np.arange(0,10)
ys = [np.random.rand(10) for _ in range(3)]

lines = []
for y in ys:
    line = go.Scatter(x=x, y=y, mode="markers+lines", opacity=.5, marker={'symbol': 'x', 'size': "15", "opacity":1})
    lines.append(line)
fig = go.Figure(
    data=lines,
    layout=go.Layout(showlegend=True)
)
plotly.offline.iplot(fig)
见这里的结果:
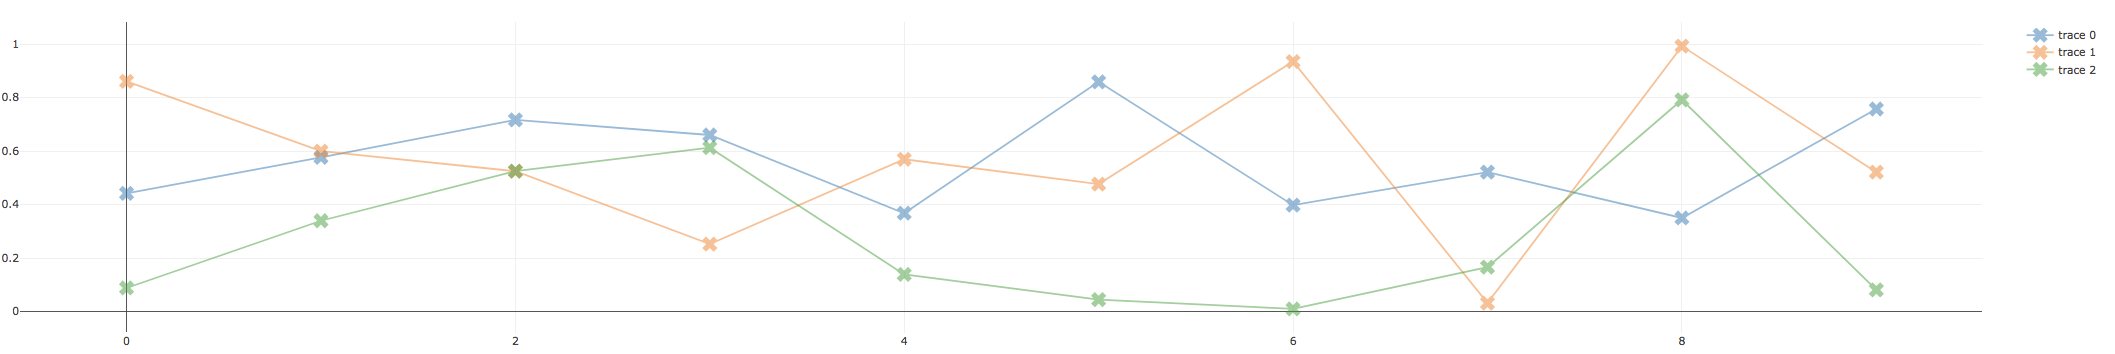
我的问题是:我的数据点很重要,线条只是视觉上的帮助。我想使行5-不透明,但标记完全不透明。
但是,当我设置opacity=.5, marker={'opacity':1}时,标记的不透明度也会降低。(我相信标记不透明度是在范围[0, line-opacity]中定义的。
有什么方法我可以得到颜色的线和调整它的不透明度(甚至在创建线,但在绘制之前)。我知道我可以创造两条痕迹,一条有点,一条有线。但是,我希望它们是相同的颜色,而不必手动指定颜色。(痕迹的数量是不同的,所以我更喜欢坚持分配不同颜色的标准机制)
编辑:我目前的解决方案是将线宽设置为0.5,这样看起来就更好了,但是很明显,这个解决方案对我有用,对那些想要粗体和不透明线条的人可能没有用。
编辑:Github有关此问题的问题/特性请求/行为:https://github.com/plotly/plotly.js/issues/2684

回答 2
Stack Overflow用户
发布于 2018-05-29 13:19:07
TL;DR - one可以使用:line=dict(color='rgba(255, 0, 0, 0.5)') - @david Parks的示例
行对象不具有不透明度属性,但是可以使用RGBA分配颜色并设置alpha。您必须使用RGBA为标记指定颜色,否则它将从行继承。
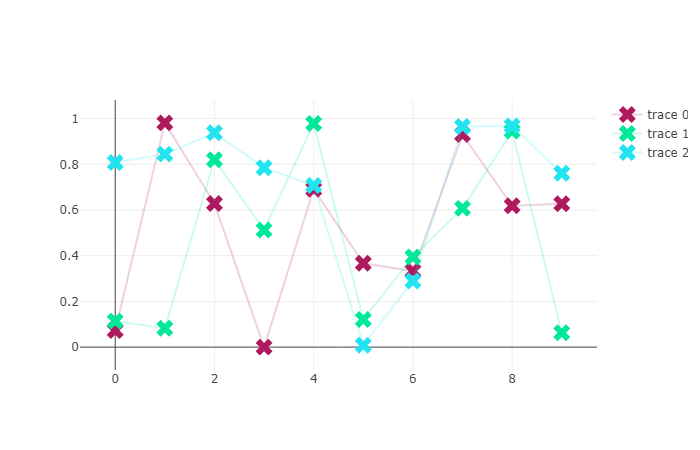
在下面的示例中,我创建了三条随机颜色的随机线条。然后,我给标记和行分配相同的颜色,但是使用字符串连接来改变线条上的不透明度。标记将完全不透明,而线条将80%透明。
import plotly
import numpy as np
import plotly.graph_objs as go

plotly.offline.init_notebook_mode(connected=True)
x = np.arange(0,10)
ys = [np.random.rand(10) for _ in range(3)]

lines = []
dots = []
for y in ys:
    my_color = ('rgba('+str(np.random.randint(0, high = 256))+','+
                str(np.random.randint(0, high = 256))+','+
                str(np.random.randint(0, high = 256)))
    # my_color := "rgba( 143, 82, 244"
    line = go.Scatter(
            x=x,
            y=y,
            mode="lines+markers",
            marker={
                    'symbol': 'x',
                    'size': "15",
                    'color':my_color+',1)' # "rgba( 143, 82, 244,1)"
                    },
            line={
                "color":my_color+',0.2)'
            })
    lines.append(line)

fig = go.Figure(
    data=lines,
    layout=go.Layout(showlegend=True)
)
plotly.offline.iplot(fig)
Stack Overflow用户
发布于 2021-06-29 00:26:57
下面是我找到的最佳答案的链接:https://github.com/plotly/plotly.js/issues/2684#issuecomment-641023041,在这里,您使用一个函数将十六进制格式下的颜色转换为rgba格式,以便像其他答案中提到的那样,在最后一个参数上定义alpha不透明度。
def hex_to_rgba(h, alpha):
    '''
    converts color value in hex format to rgba format with alpha transparency
    '''
    return tuple([int(h.lstrip('#')[i:i+2], 16) for i in (0, 2, 4)] + [alpha])
然后你就可以用它
import plotly.graph_objects as go
import plotly.express as px
COLORS = px.colors.qualitative.D3

hex_color = COLORS[0]  # Blue

traces = [
    go.Scatter(
        x=[0, 1],
        y=[0, 1],
        name='Identity line',
        showlegend=False,
        line=dict(
            color='rgba' + str(hex_to_rgba(
                h=hex_color,
                alpha=0.25
            )),
            width=2,
            dash='dash'
        ),
        marker=dict(
            size=7,
            symbol='circle',
            color='rgba' + str(hex_to_rgba(
                h=hex_color,
                alpha=1
            ))
        ),
    )
]

layout = go.Layout(template='simple_white')
figure = go.Figure(data=traces, layout=layout)
figure.show()这里是蓝色:十六进制格式是'#1F77B4',rgba格式是'rgba(31, 119, 180, 0.5)'
https://stackoverflow.com/questions/50488894
复制
![[答疑]对于Oracle来说,土地管理是非核心域吗](https://ask.qcloudimg.com/http-save/yehe-6288414/3830926e3bbf066fa10af52410e47c92.png)

![Phoenix Framework对于Tree该方法节点设置不同的图标,每个[通俗易懂]](https://ask.qcloudimg.com/http-save/yehe-8223537/bdf8ebc19d530afbb348b0c584d237a5.png)


腾讯云开发者
