
在r中增加参数字体大小而不丢失参数,并在栏附近绘制值。
我几乎完成了r.的barplot,但它需要最后的改进.
这是我的密码
HSI <- c(126,104,112,94,86)
HSI <- HSI-100
x <- barplot(HSI, main="HSI of Age", col=rainbow(10), names.arg=Category,
                           cex.names=0.2, las=1, horiz=T,axes=F, xlim=c(-50,50))
axis(1,at=seq(-50,50,10), labels = seq(50,150,10))
text(x, labels = 100+HSI, pos = 2)
我得到的图表是
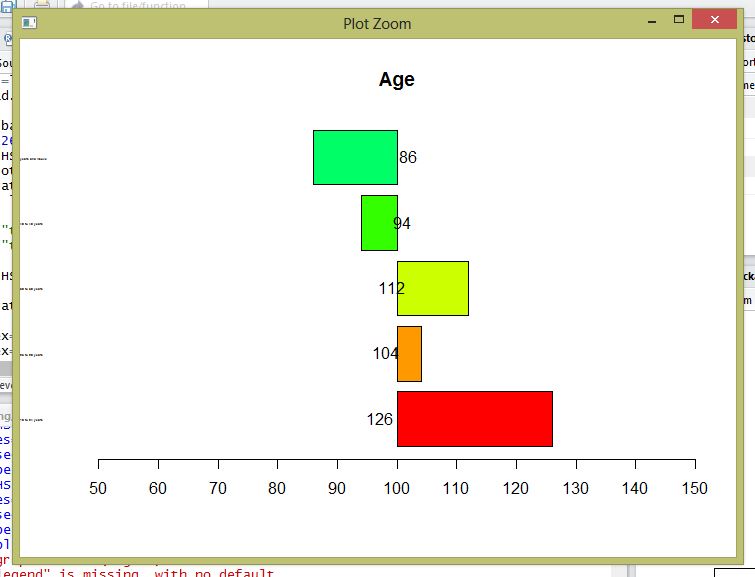
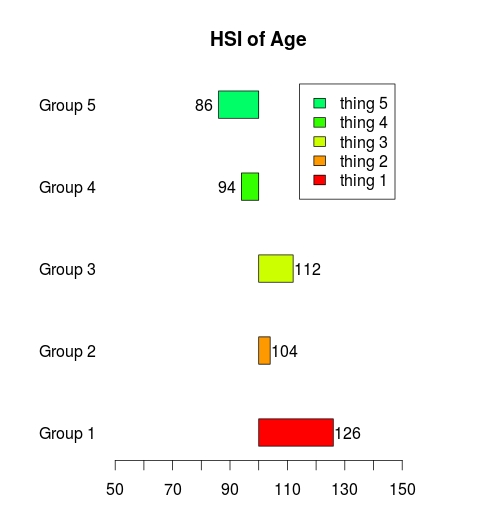
我真正想要的是下面这张照片,
- 值,即126,108.应正确放置(靠近条形图)。
- 争论的名字太小了。我想让他们看得清楚。当我试图使用cex.names增加大小时,它不会出现在图中。
- 我还试着把传说包括进去。它没有起作用。
- 另外,如何减少棒材的厚度?

回答 3
Stack Overflow用户
发布于 2015-05-23 19:21:14
如果您愿意使用ggplot2,几乎所有的东西都可以在图形语法中进行修改和调整。因此,对于您的数据这里:
HSI <- c(126,104,112,94,86)
HSI <- HSI-100
df <- data.frame(HSI=HSI,
                 Category=c("Above Rs 1cr", "Rs 50 Lakh to Rs 1cr",
                            "Rs 30 to 50 Lakh", "Rs 20 to 30s Lakh",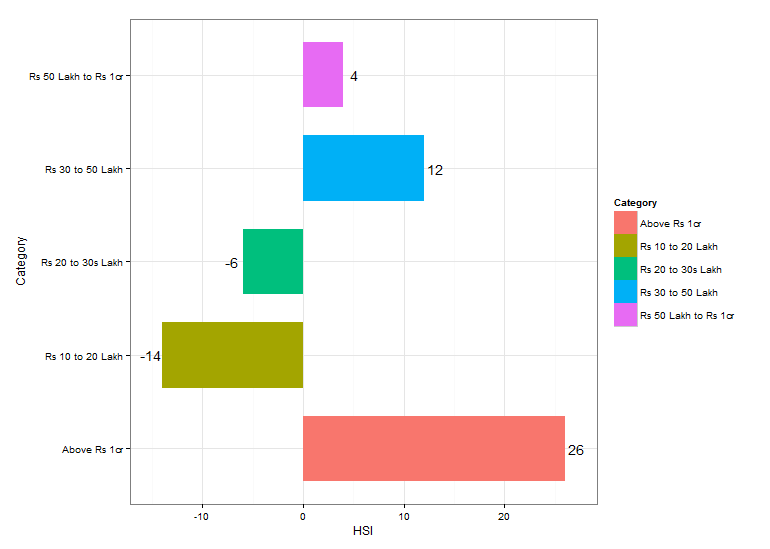
"Rs 10 to 20 Lakh"))我们可以使用ggplot创建一个条形图,您可以在其中控制您所要求的许多项:
ggplot(df, aes(x=Category, y=HSI, fill=Category)) +
  geom_bar(stat = "identity", aes(width=0.7)) + # adjust width to change thickness
  geom_text(aes(label=HSI, y=HSI+1.1*sign(HSI)),# adjust 1.1 -  to change how far away from the final point the label is
            size=5 # adjust the size of label text
            )+
  coord_flip() +
  theme_bw()
产出:
如果您想要更多的信息,您将不得不阅读有关如何更改项目。几乎任何东西都可以在ggplot中改变。
Stack Overflow用户
发布于 2015-05-23 19:10:31
- 值,即126,108.应正确放置(靠近条形图)。
可以为pos定义一个值向量,以便为每个条形定义单独的位置。
- 争论的名字太小了。我想让他们看得清楚。当尝试使用cex.names增加大小时,它不会出现在图中
可以在cex调用中使用text参数
- 我还试着把传说包括进去。它没有起作用。
请参阅?legend
- 另外,如何减少棒材的厚度?
可以使用space参数在条形图中添加空格。
一些代码
HSI <- c(126,104,112,94,86)
HSI <- HSI-100
x <- barplot(HSI, main="HSI of Age", col=rainbow(10), space=2,
horiz=T,axes=F, xlim=c(-50,50))
axis(1,at=seq(-50,50,10), labels = seq(50,150,10))
# add vertical line at HSI=100(0)
abline(v=0)
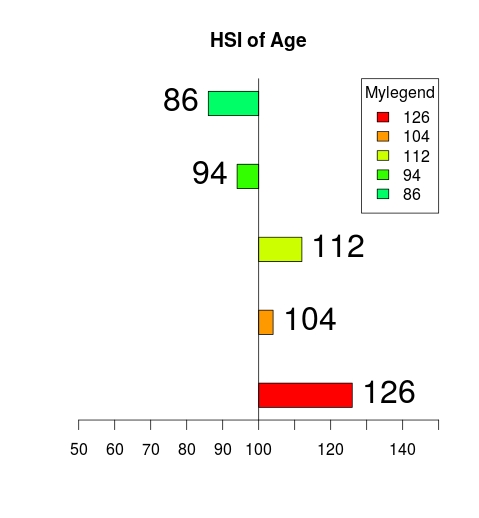
text(HSI, x, labels = 100+HSI, pos = c(2, 4)[(HSI>0)+1], cex=2)
legend("topright", legend=HSI+100, title="Mylegend", fill=rainbow(10), horiz=F)这给
Stack Overflow用户
发布于 2015-05-23 18:57:57
这是四个不同的问题。对于名称太小的问题2,请将cex.names更改为更大的(如1或2)。我无法重现它没有出现在情节中的问题,但解决这个问题的一个办法可能是改变情节的边缘:
par(mar=c(3,6,3,3))第二个论点是左边的边距.
我没有足够的声誉来补充评论要求澄清,所以我必须在这里说。你制作传奇有什么问题?我可以在legend(15,5,"legend stuff")中做得很好,但是更好的方法是使用内置选项legend.text,因为您的情节高度不明确。
legend.text=c("thing 1","thing 2", "thing 3", "thing 4", "thing 5")只需将其作为一个参数放到barplot()函数中即可。
问题1的一个解决办法是为文本的位置选择不同的数字。例如:
HSITextPosition = 5*sign(HSI)+HSI
text(HSITextPosition, x, labels = 100+HSI)对于问题4,您需要在space中更改barplot()选项,从而调整各条之间的空间。
总的来说,您应该阅读有关barplot()函数或您正在使用的任何其他函数的文档,因为它解释了其中的大部分内容。完整代码:
HSI <- c(126,104,112,94,86)
HSI <- HSI-100
HSITextPosition = 5*sign(HSI)+HSI

Category <- c("Group 1","Group 2","Group 3","Group 4","Group 5")

par(mar=c(3,6,4,4))
x <- barplot(HSI, main="HSI of Age", col=rainbow(10), names.arg=Category,
         cex.names=1, las=1, horiz=T,axes=F,
         xlim=c(-50,50),space=2,
         legend.text=c("thing 1","thing 2", "thing 3", "thing 4", "thing 5"))
axis(1,at=seq(-50,50,10), labels = seq(50,150,10))
text(HSITextPosition, x, labels = 100+HSI)
https://stackoverflow.com/questions/30419477
复制


腾讯云开发者
