python matplotlib散点图颜色错误
我试图用x和y网格创建一个散点图,其中每个点都通过一个预先赋值的值获得颜色:
{x: 1, y: 2, value: n}我有一个x和y的列表以及另一个值列表,尝试使用以下方法:
# make range of x(0 - 359) and y(-90 - 90)
x, y = np.meshgrid(range(0, 360), range(-90, 90))
colors = [a very long list (64800 values, one for each point)]
print(colors)
plt.scatter(x, y, c=colors)
plt.colorbar()
plt.show()
错误:
追溯(最近一次调用):文件"C:\python3.6.6\lib\site-packages\matplotlib\colors.py",行158,在to_rgba rgba = _colors_full_map.cachec中,alpha KeyError:(1.0986122886681098,无)在处理上述异常时发生了另一个异常:跟踪(最近一次调用):文件"C:\python3.6.6\lib\site-packages\matplotlib\axes\axes.py",行4210,在分散色= "C:\python3.6.6\lib\site-packages\matplotlib\colors.py",(C)文件第259行中,在to_rgba_array resulti = to_rgba(cc,alpha)文件第160行中,在to_rgba rgba = _to_rgba_no_colorcycle(c )中,文件"C:\python3.6.6\lib\site-packages\matplotlib\colors.py",第211行,在_to_rgba_no_colorcycle RGBA参数:{!r}.format(Orig_c) ValueError:无效RGBA参数: 1.0986122886681098在处理上述异常时发生了另一个异常:回溯(最近一次调用):文件"C:/Users/amit neumark/Documents/עמית/alpha/grbs数据/grbs/find_burst_location.py“,第168行,在main() ra2中,dec2 =chi_square(模型、关系)文件“C:/User/amit neumark/Documents/עמית/alpha/grbs data/grbs/find_burst_location.py”中的第161行,"C:/Users/amit neumark/Documents/עמית/alpha/grbs数据/grbs/find_burst_Location.py“,第33行,在chi_square create_plot (Sum)文件"C:/Users/amit neumark/Documents/עמית/alpha/grbs data/grbs/find_burst_location.py“中,第134行,在create_plot plt.scatter(x,y,c=colors)文件第2793行,在分散格式verts=verts,edgecolors=edgecolors,data=data中,**kwargs)文件"C:\python3.6.6\lib\site-packages\matplotlib\_init__.py",第1785行,在内部返回函数(ax,*args,**kwargs)文件"C:\python3.6.6\lib\site-packages\matplotlib\axes\_axes.py",第4223行,在散射.format(nc=n_elem,xs=x.size,ys=y.size) ValueError中:'c‘参数有64800个元素,对于大小为64800的“x”不可接受,64800码的“Y”。
回答 2
Stack Overflow用户
发布于 2019-01-08 12:33:05
问题在于您的x和y数据,而不是颜色c参数。您的x和y当前是一个2d数组(meshgrid)。这应该是一份立场清单。这样做的一种方法是将你的2d网格网格压平,以得到一个一维数组。X和y数据点之间的一对一对应关系将得到保持。网格对散乱的三维图形正常工作。
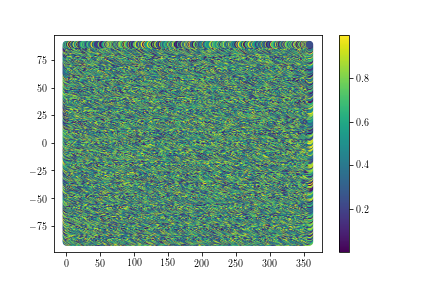
我选择了一些随机的颜色来提供一个解决方案。
x, y = np.meshgrid(range(0, 360), range(-90, 90))
colors = np.random.random(360*180)
plt.scatter(x.flatten(), y.flatten(), c=colors)
plt.colorbar()
Stack Overflow用户
发布于 2019-01-08 17:07:28
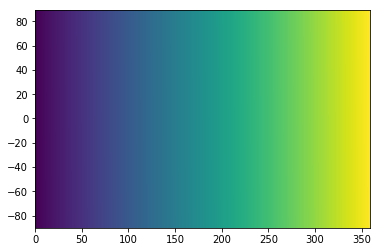
使用像imshow或pcolormesh这样的工具来绘制图形可能更有意义。这在x,y坐标的网格上创建了一个“热图”。对于这些函数,x,y网格是可选的。
colors = np.arange(64800)

plt.pcolormesh(colors.reshape(360, 180).T)
# OR #
x, y = np.meshgrid(range(0, 360), range(-90, 90))
plt.pcolormesh(x, y, colors.reshape(360, 180).T)
你应该注意如何重塑colors。可以按行填充,也可以按列填充。默认为by行(最后一个轴)。这也是重要的注意,在另一个答案,因为你平铺你的网格。
https://stackoverflow.com/questions/54099158
复制![uwsgi php,Nginx+uWSGI[通俗易懂]](https://ask.qcloudimg.com/http-save/yehe-8223537/d4ba39529a94944a0d59f6249641a551.jpg)
![nginx与uWSGI[通俗易懂]](https://ask.qcloudimg.com/http-save/yehe-8223537/bff42af4fe95fe5073156aed03188d05.png)


相似问题
Java:生活游戏-与邻居的问题
生活的游戏邻居问题。数组索引越界异常
康威的生活游戏邻居计数
康威的生活游戏,计算邻居
生活的游戏C++,检查邻居
领取专属 10元无门槛券
AI混元助手 在线答疑

洞察 腾讯核心技术
剖析业界实践案例

腾讯云开发者
