用 Python 实现 Sebutape Patches 图像自动分割与数据可视化(含完整代码)
原创
用 Python 实现 Sebutape Patches 图像自动分割与数据可视化(含完整代码)
原创
Scivaro_科采通
发布于 2025-07-02 17:19:23
发布于 2025-07-02 17:19:23
作者:科采通|标签:Sebutape、生物图像处理、Python、OpenCV、皮脂量化分析
一、引言
在皮肤科学和化妆品功效评估中,Sebutape Patches 是标准化的皮脂采样工具。以往分析这些贴片上的油脂分泌斑点,往往依赖 ImageJ 等手动图像软件。
但对于需要处理大量图像的科研项目或产品测试团队而言,Python 自动批量处理和数据分析更高效、更灵活。
本文将手把手带你用 Python 完成如下目标:
🎯 分析目标
- 自动读取 Sebutape 图像
- 提取皮脂斑点区域(图像分割)
- 统计斑点数量、面积分布等指标
- 可视化输出分析图表与标记图像
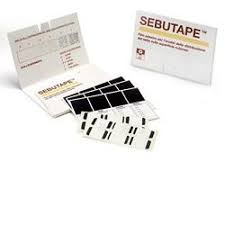
Sebutape Patches
二、环境准备
推荐环境:
- Python ≥ 3.8
- OpenCV
- NumPy
- Matplotlib
- Pandas
- scikit-image(可选)
安装依赖:
bash复制编辑pip install opencv-python numpy matplotlib pandas三、图像自动处理完整代码
python复制编辑import cv2
import numpy as np
import matplotlib.pyplot as plt
import pandas as pd
import os

# === 参数设置 ===
input_path = 'images/'  # 存放 Sebutape 图像的文件夹
output_path = 'results/'  # 保存处理结果的文件夹
os.makedirs(output_path, exist_ok=True)

# 结果保存表格
results = []

# === 图像处理函数 ===
def process_image(file_path):
    img = cv2.imread(file_path, cv2.IMREAD_GRAYSCALE)
    blurred = cv2.GaussianBlur(img, (5, 5), 0)

    # 自动阈值分割(Otsu)
    _, thresh = cv2.threshold(blurred, 0, 255, cv2.THRESH_BINARY_INV + cv2.THRESH_OTSU)

    # 找轮廓
    contours, _ = cv2.findContours(thresh, cv2.RETR_EXTERNAL, cv2.CHAIN_APPROX_SIMPLE)

    areas = []
    img_out = cv2.cvtColor(img, cv2.COLOR_GRAY2BGR)

    for cnt in contours:
        area = cv2.contourArea(cnt)
        if area > 50:  # 去除小噪点
            areas.append(area)
            cv2.drawContours(img_out, [cnt], -1, (0, 255, 0), 1)

    return areas, img_out

# === 主循环处理 ===
for file in os.listdir(input_path):
    if file.lower().endswith(('.jpg', '.png', '.tif')):
        filepath = os.path.join(input_path, file)
        areas, marked_img = process_image(filepath)

        # 保存标注图
        out_img_path = os.path.join(output_path, f"marked_{file}")
        cv2.imwrite(out_img_path, marked_img)

        # 结果记录
        total_area = sum(areas)
        count = len(areas)
        avg_area = total_area / count if count > 0 else 0

        results.append({
            'filename': file,
            'count': count,
            'total_area': round(total_area, 2),
            'avg_area': round(avg_area, 2)
        })

        print(f"处理完成:{file},识别皮脂点 {count} 个")

# === 保存 CSV 统计结果 ===
df = pd.DataFrame(results)
df.to_csv(os.path.join(output_path, 'sebutape_analysis.csv'), index=False)
print("所有图像处理完成,结果已保存至 CSV。")
四、分析结果示例(截图)
你将获得:
- 带轮廓标记的输出图(
marked_*.png) - 分析表格
sebutape_analysis.csv,包含每张图的:- 斑点数量(count)
- 总斑点面积(总皮脂量 proxy)
- 平均斑点面积(反映单个油脂单位产量)
五、数据可视化扩展(选做)
python复制编辑# 加载结果
df = pd.read_csv(os.path.join(output_path, 'sebutape_analysis.csv'))

# 绘制斑点数量条形图
plt.figure(figsize=(10, 5))
plt.bar(df['filename'], df['count'], color='steelblue')
plt.title("Sebutape 每张图的皮脂点数量")
plt.xticks(rotation=45)
plt.ylabel("斑点数量")
plt.tight_layout()
plt.show()
你也可以画出 total_area、avg_area 的箱线图、直方图、热图等。
六、使用建议
项目 | 建议值 |
|---|---|
阈值方法 | Otsu 自动法 |
面积过滤 | >50 像素²(排除灰尘) |
拍照分辨率 | ≥ 300 dpi |
背景色 | 纯白或浅灰(避免误识别) |
七、未来优化方向
- ✅ 批量处理多区域图像(例如同时含多个采样位点)
- ✅ 引入皮肤坐标体系(与拍照部位匹配)
- ✅ 使用深度学习方法(如 U-Net)做更精准斑点分割
- ✅ 将面积换算为 μg/cm²(需标定)
八、结语
本教程提供了一个开源、可复用的基础框架,帮助你实现 从 Sebutape 图像 → 数据分析 → 可视化展示 的全过程。无论你是做功效测试、痤疮研究还是产品开发验证,它都能大幅提升效率与客观性。
📁 开源数据包(图像 + 脚本 + 示例结果)将在后续发布专栏中附上,欢迎关注! 💬 如果你需要定制分析(多区域图、多图叠加、统计报告),欢迎评论或私信作者“科采通”。
原创声明:本文系作者授权腾讯云开发者社区发表,未经许可,不得转载。
如有侵权,请联系 cloudcommunity@tencent.com 删除。
原创声明:本文系作者授权腾讯云开发者社区发表,未经许可,不得转载。
如有侵权,请联系 cloudcommunity@tencent.com 删除。
评论
登录后参与评论
推荐阅读
目录
腾讯云开发者

Copyright © 2013 - 2026 Tencent Cloud. All Rights Reserved. 腾讯云 版权所有
深圳市腾讯计算机系统有限公司 ICP备案/许可证号:粤B2-20090059 ![]() 粤公网安备44030502008569号
粤公网安备44030502008569号
腾讯云计算(北京)有限责任公司 京ICP证150476号 | 京ICP备11018762号