在R中按y值重新排序列?
在R中按y值重新排序列?
提问于 2017-02-17 03:16:43
我有一个结构如下的数据帧:
> head(df)
    Zip Crimes Population    CPC
1 78701   2103       6841 0.3074
2 78719    186       1764 0.1054
3 78702   1668      21334 0.0782
4 78723   2124      28330 0.0750
5 78753   3472      49301 0.0704
6 78741   2973      44935 0.0662
我使用这个函数来绘制它:
p = ggplot(df, aes(x=Zip, y=CPC)) + geom_col() + theme(axis.text.x = element_text(angle = 90))这是我得到的图表:
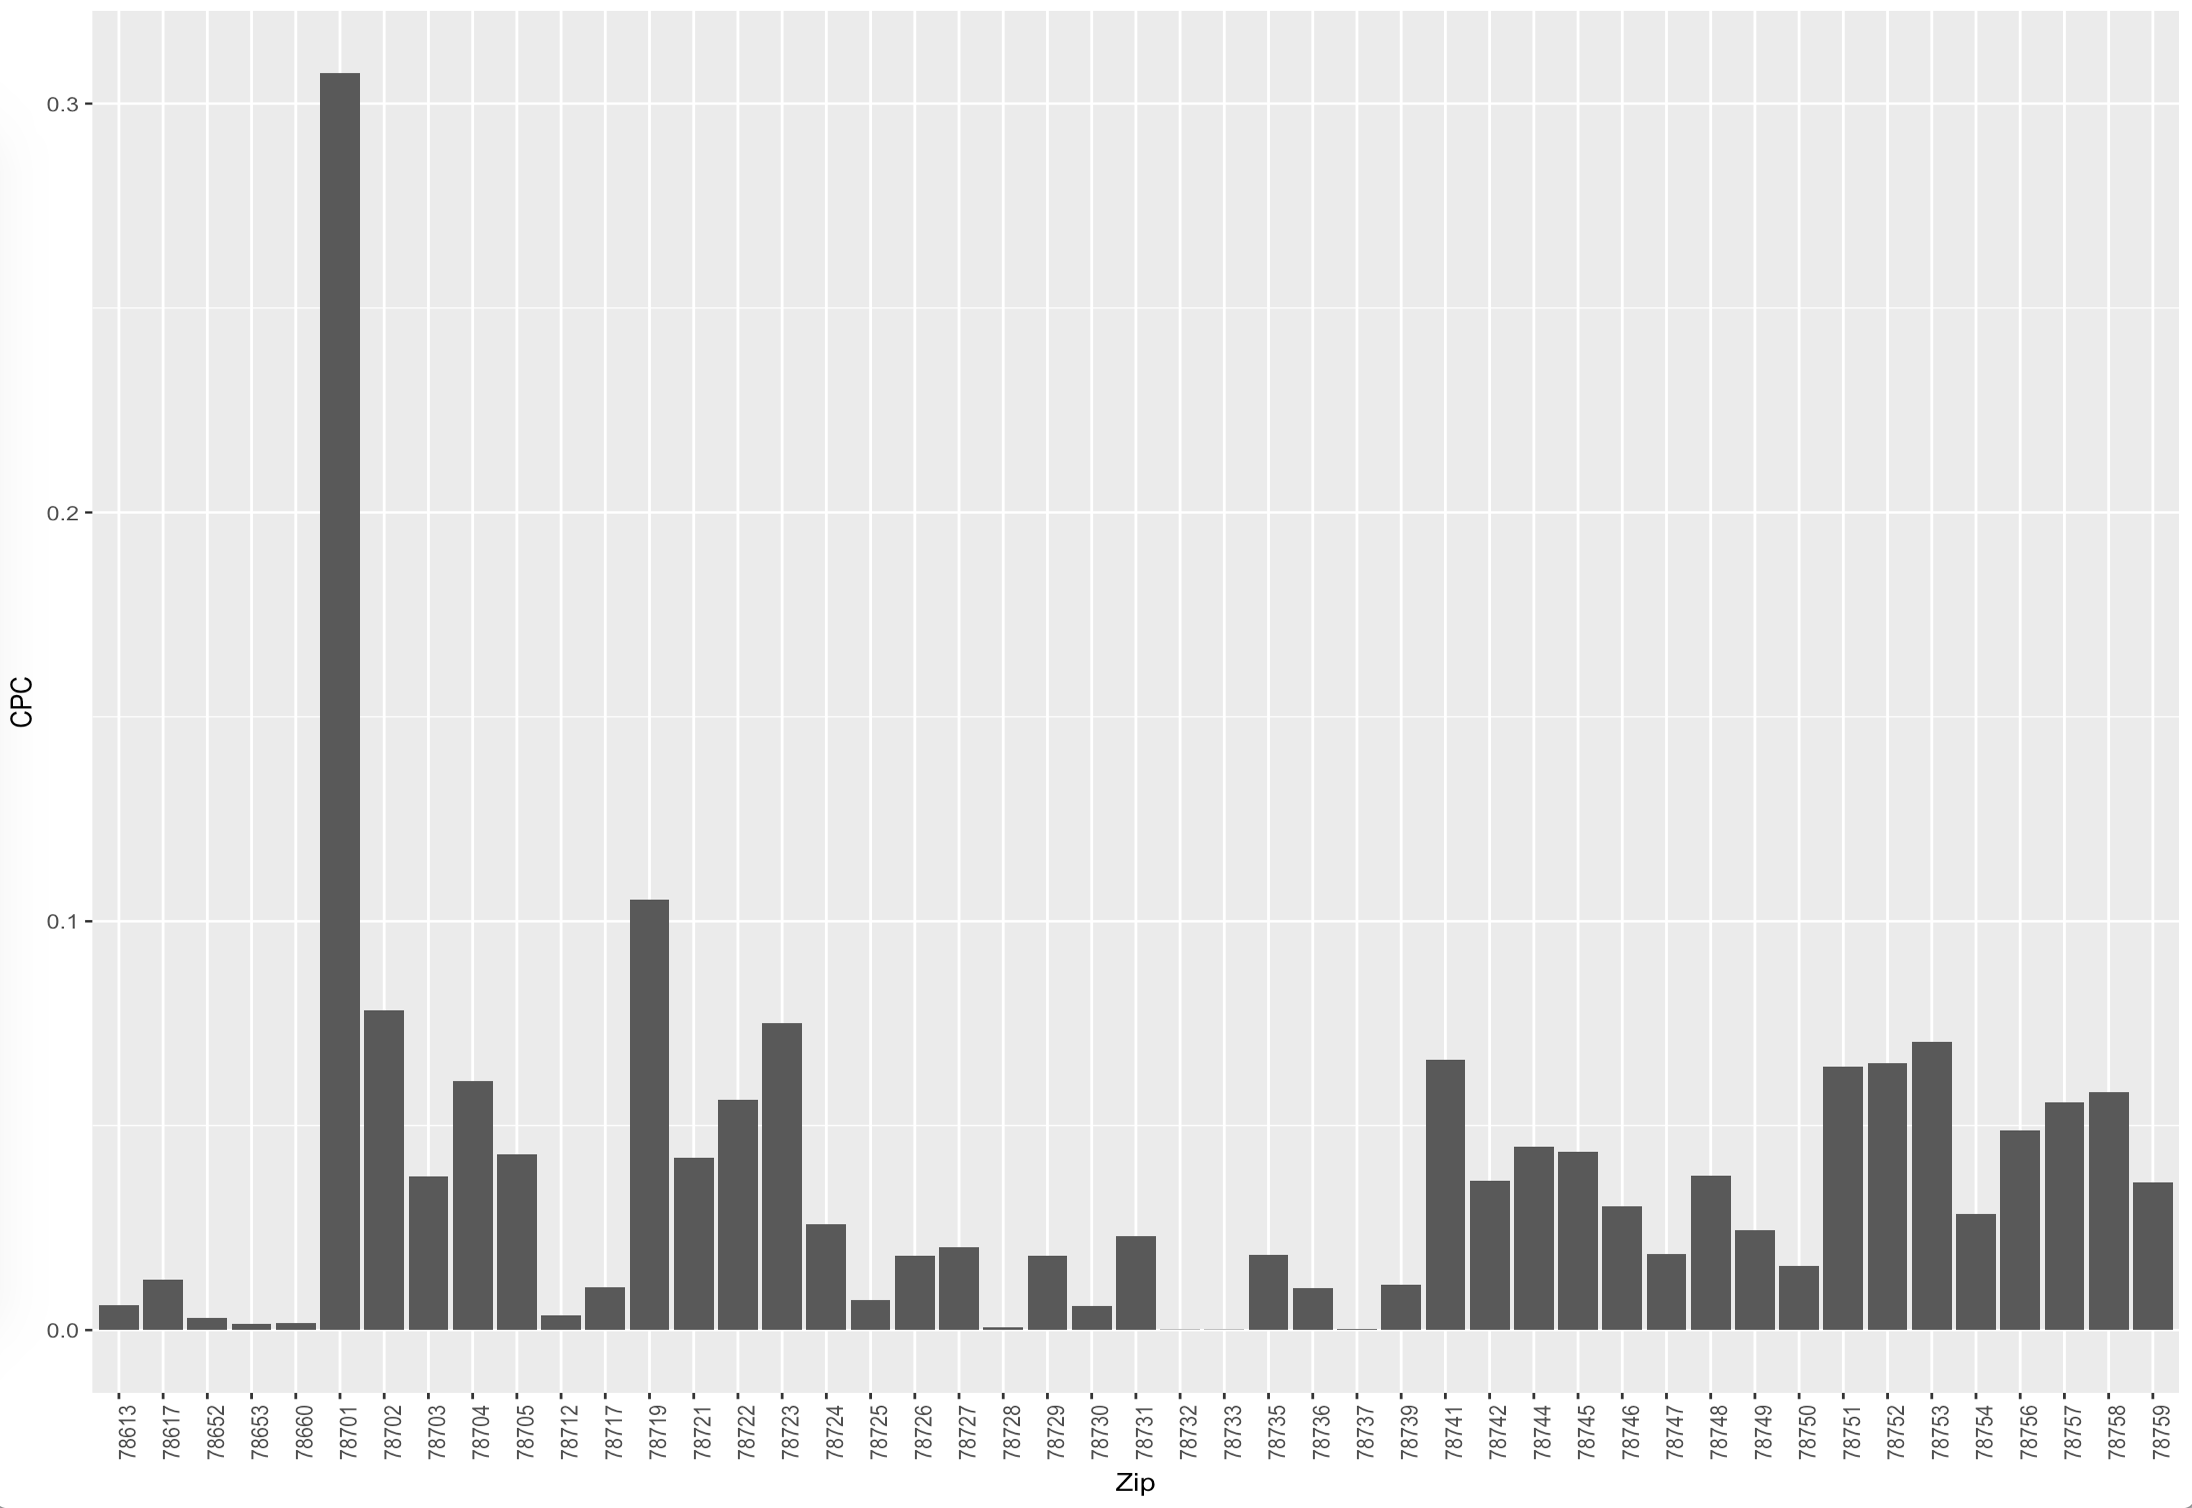
如何按CPC排序绘图,其中最高的邮政编码在左侧?
回答 2
Stack Overflow用户
回答已采纳
发布于 2017-02-17 03:39:23
将Zip转换为按负CPC排序的因子。例如,在绘图之前尝试使用df$Zip <- reorder(df$Zip, -df$CPC)。下面是一个小示例:
d <- data.frame(
  x = c('a', 'b', 'c'),
  y = c(5, 15, 10)
)

library(ggplot2)

# Without reordering
ggplot(d, aes(x, y)) + geom_col()

# With reordering
d$x <- reorder(d$x, -d$y)
ggplot(d, aes(x, y)) + geom_col()

Stack Overflow用户
发布于 2017-02-17 08:18:58
按降序对数据框进行排序,然后绘制它:
library(dplyr)
df <- arrange(df,desc(CPC))
ggplot...页面原文内容由Stack Overflow提供。腾讯云小微IT领域专用引擎提供翻译支持
原文链接:
https://stackoverflow.com/questions/42288761
复制相关文章
相似问题
腾讯云开发者
