
如何通过matlab中的边缘点绘制图像的光滑边界
如何通过matlab中的边缘点绘制图像的光滑边界
提问于 2017-05-26 03:36:19
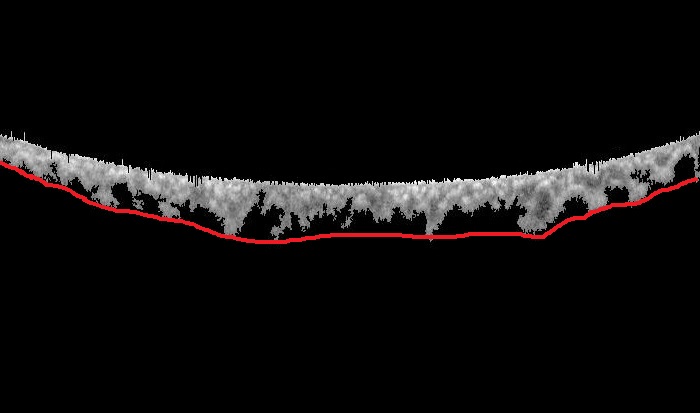
我有一个分割的区域,如图1所示,我想通过连接图2所示的下边缘点来用matlab绘制下边界。我不能像图2那样绘制图。所以我做了一些形态学操作,比如填充、加厚、关闭,但没有得到plot.can的想法--你提供了matlab代码。
图1
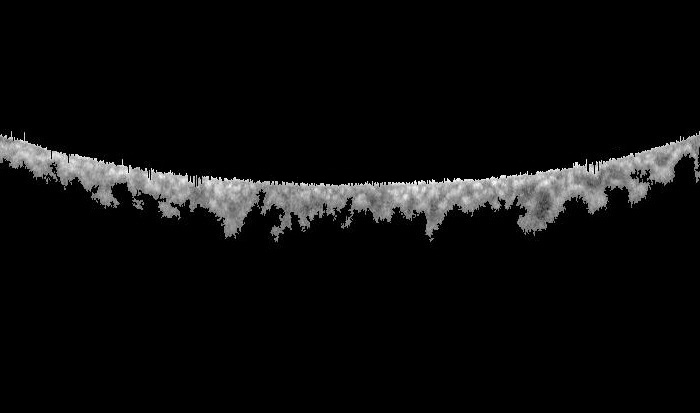
图2
回答 1
Stack Overflow用户
回答已采纳
发布于 2017-05-26 08:22:08
这里有一个解决方案
- 对图像进行阈值处理,所以它是二进制的,因为这张图像很简单
- 标识每列中最低像素的位置。
- 只需取第9列的最大值即可平滑。如果你只想得到最低点,那么你可以停在下面代码的第4行!
对代码进行注释以了解更多细节:
img = rgb2gray(imread('1.jpg')); % Read image
img = img > 0.5;                 % Threshold to get binary image
% Get last row where there is a 1 pixel in the image for each column
lastrow = max(repmat((1:size(img,1))', 1, size(img,2)).*img,[],1);
res = 30;                        % Pixel resolution for line averaging
% Ensure res divides num. columns by padding the end of the vector
lastrowpadded = [lastrow, NaN(1, res - mod(numel(lastrow),res))];
% Reshape into columns of length 'res', then get the max row number
lastrow2 = max(reshape(lastrowpadded,res,[]),[],1);
% Plots
imshow(img);
hold on
plot(1:size(img,2), lastrow, '.')
plot(res/2:res:size(lastrowpadded,2)-res/2, lastrow2, 'linewidth', 1.5)
hold off
legend('lowest points', 'smoothed lowest points')
结果:
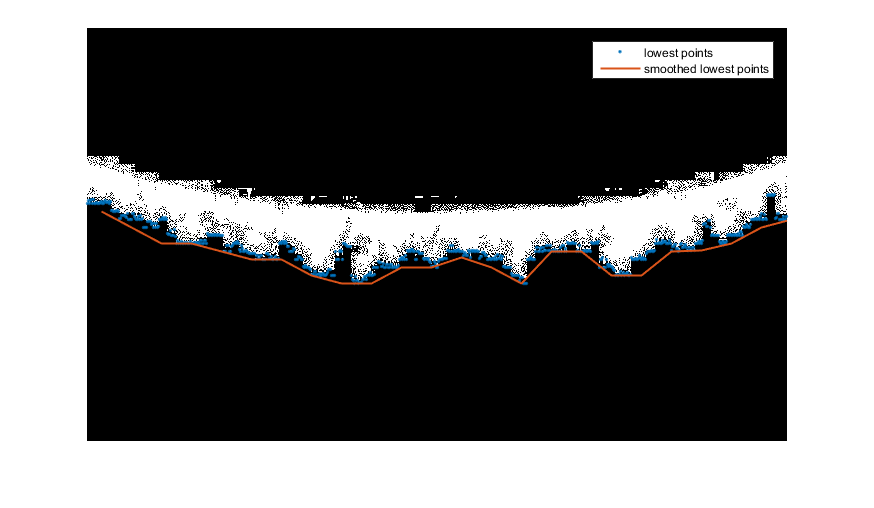
备注:,因为该图像在左上角用(0,0)绘制,如果没有该图像,则此图将被颠倒。从图像的高度减去lastrow2或lastrow值来纠正这一点。
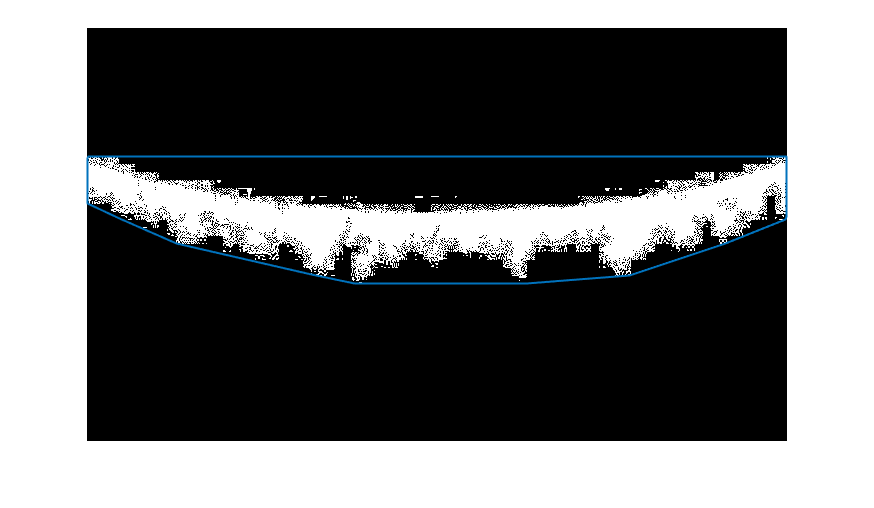
编辑:您也可能对创建凸包的convhull感兴趣。
[X,Y] = find(img); % After thresholding image as before, get X,Y coords
K = convhull(X,Y); % Get convex hull indices
imshow(img)        % Show image
hold on
plot(Y(K),X(K),'linewidth',1.5) % Plot convex hull
结果:
页面原文内容由Stack Overflow提供。腾讯云小微IT领域专用引擎提供翻译支持
原文链接:
https://stackoverflow.com/questions/44193189
复制相关文章
相似问题
腾讯云开发者

Copyright © 2013 - 2026 Tencent Cloud. All Rights Reserved. 腾讯云 版权所有
深圳市腾讯计算机系统有限公司 ICP备案/许可证号:粤B2-20090059 ![]() 粤公网安备44030502008569号
粤公网安备44030502008569号
腾讯云计算(北京)有限责任公司 京ICP证150476号 | 京ICP备11018762号