
在PyQt中嵌入“数字型”海图
我正在使用PyQt (比格图)的包装器来构建GUI应用程序。我希望使用海航嵌入一个MatplotlibWidget图。但是,我的问题是Seaborn包装器方法(如FacetGrid )不接受外部数字句柄。此外,当我试图用MatplotlibWidget生成的图形更新FacetGrid对象底层图形(.fig)时,它无法工作(在draw之后没有绘图)。有什么解决办法吗?
回答 2
Stack Overflow用户
发布于 2017-01-16 13:22:41
Seaborn的Facetgrid提供了一个方便的功能,可以将熊猫的数据文件快速连接到matplotlib pyplot接口。
然而,在GUI应用程序中,很少需要使用pyplot,而是使用matplotlib API。
这里您面临的问题是Facetgrid已经创建了自己的matplotlib.figure.Figure对象(Facetgrid.fig)。而且,MatplotlibWidget会创建自己的图形,因此您将得到两个数字。
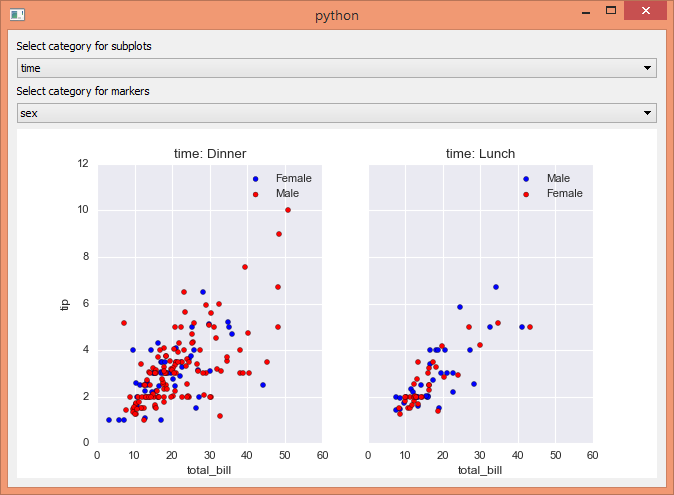
现在,让我们退一步:原则上,可以在PyQt中使用海运的PyQt绘图,方法是首先创建绘图,然后将结果图形提供给图形画布(matplotlib.backends.backend_qt4agg.FigureCanvasQTAgg)。下面是如何做到这一点的一个示例。
from PyQt4 import QtGui, QtCore
from matplotlib.backends.backend_qt4agg import FigureCanvasQTAgg as FigureCanvas
import sys
import seaborn as sns
import matplotlib.pyplot as plt

tips = sns.load_dataset("tips")


def seabornplot():
    g = sns.FacetGrid(tips, col="sex", hue="time", palette="Set1",
                                hue_order=["Dinner", "Lunch"])
    g.map(plt.scatter, "total_bill", "tip", edgecolor="w")
    return g.fig


class MainWindow(QtGui.QMainWindow):
    send_fig = QtCore.pyqtSignal(str)

    def __init__(self):
        super(MainWindow, self).__init__()

        self.main_widget = QtGui.QWidget(self)

        self.fig = seabornplot()
        self.canvas = FigureCanvas(self.fig)

        self.canvas.setSizePolicy(QtGui.QSizePolicy.Expanding,
                      QtGui.QSizePolicy.Expanding)
        self.canvas.updateGeometry()
        self.button = QtGui.QPushButton("Button")
        self.label = QtGui.QLabel("A plot:")

        self.layout = QtGui.QGridLayout(self.main_widget)
        self.layout.addWidget(self.button)
        self.layout.addWidget(self.label)
        self.layout.addWidget(self.canvas)

        self.setCentralWidget(self.main_widget)
        self.show()


if __name__ == '__main__':
    app = QtGui.QApplication(sys.argv)
    win = MainWindow()
    sys.exit(app.exec_())
虽然这样做很好,但它有一点问题,如果它是有用的。在大多数情况下,在GUI中创建一个地块的目的是根据用户交互进行更新。在上面的示例中,这是非常低效率的,因为它需要创建一个新的图形实例,用这个图创建一个新画布,并用新的画布实例替换旧画布实例,然后将它添加到布局中。
请注意,这个问题是特定于海运中的绘图函数的,这些绘图函数在图形级别上工作,如lmplot、factorplot、jointplot、FacetGrid以及可能的其他功能。
其他函数如regplot、boxplot、kdeplot在轴级工作,并接受matplotlib axes对象作为参数(sns.regplot(x, y, ax=ax1))。
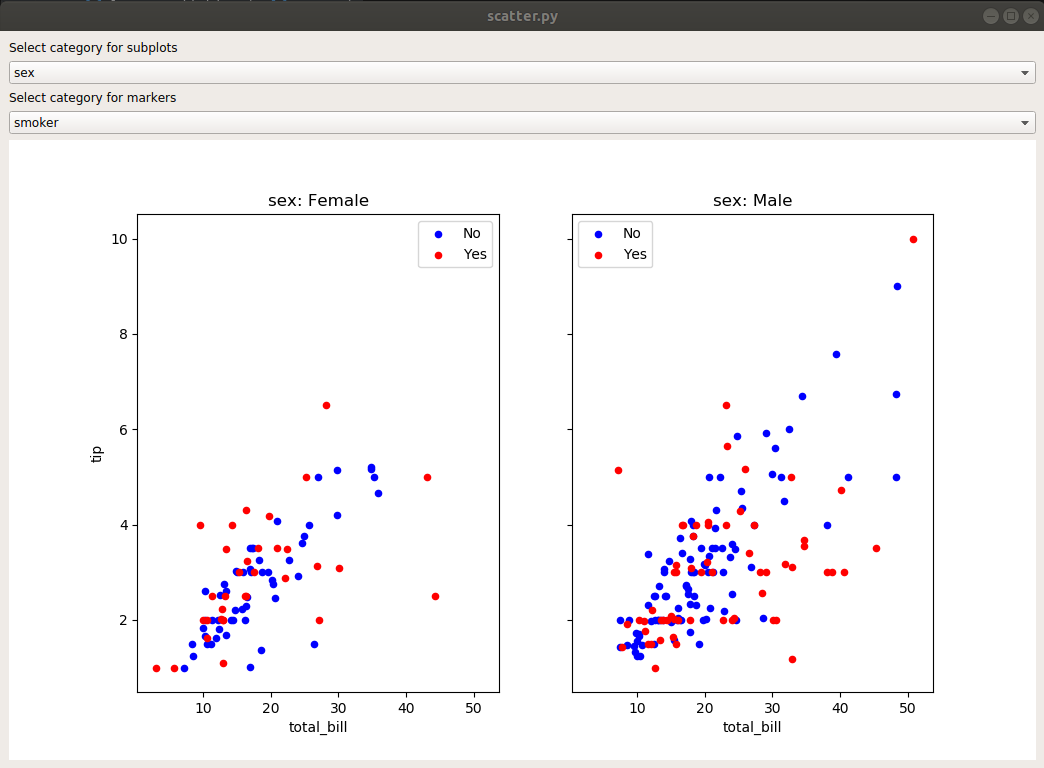
可能的解决方案首先创建子图轴,然后再绘制到这些轴,例如使用熊猫绘图功能。
df.plot(kind="scatter", x=..., y=..., ax=...)应该将ax设置为先前创建的轴。
这允许更新GUI中的情节。参见下面的示例。当然,正常的matplotlib绘图(ax.plot(x,y))或使用上面讨论的海运轴级函数也同样有效。
from PyQt4 import QtGui, QtCore
from matplotlib.backends.backend_qt4agg import FigureCanvasQTAgg as FigureCanvas
from matplotlib.figure import Figure
import sys
import seaborn as sns

tips = sns.load_dataset("tips")

class MainWindow(QtGui.QMainWindow):
    send_fig = QtCore.pyqtSignal(str)

    def __init__(self):
        super(MainWindow, self).__init__()

        self.main_widget = QtGui.QWidget(self)

        self.fig = Figure()
        self.ax1 = self.fig.add_subplot(121)
        self.ax2 = self.fig.add_subplot(122, sharex=self.ax1, sharey=self.ax1)
        self.axes=[self.ax1, self.ax2]
        self.canvas = FigureCanvas(self.fig)

        self.canvas.setSizePolicy(QtGui.QSizePolicy.Expanding,
                                  QtGui.QSizePolicy.Expanding)
        self.canvas.updateGeometry()

        self.dropdown1 = QtGui.QComboBox()
        self.dropdown1.addItems(["sex", "time", "smoker"])
        self.dropdown2 = QtGui.QComboBox()
        self.dropdown2.addItems(["sex", "time", "smoker", "day"])
        self.dropdown2.setCurrentIndex(2)

        self.dropdown1.currentIndexChanged.connect(self.update)
        self.dropdown2.currentIndexChanged.connect(self.update)
        self.label = QtGui.QLabel("A plot:")

        self.layout = QtGui.QGridLayout(self.main_widget)
        self.layout.addWidget(QtGui.QLabel("Select category for subplots"))
        self.layout.addWidget(self.dropdown1)
        self.layout.addWidget(QtGui.QLabel("Select category for markers"))
        self.layout.addWidget(self.dropdown2)

        self.layout.addWidget(self.canvas)

        self.setCentralWidget(self.main_widget)
        self.show()
        self.update()

    def update(self):

        colors=["b", "r", "g", "y", "k", "c"]
        self.ax1.clear()
        self.ax2.clear()
        cat1 = self.dropdown1.currentText()
        cat2 = self.dropdown2.currentText()
        print cat1, cat2

        for i, value in enumerate(tips[cat1].unique().get_values()):
            print "value ", value
            df = tips.loc[tips[cat1] == value]
            self.axes[i].set_title(cat1 + ": " + value)
            for j, value2 in enumerate(df[cat2].unique().get_values()):
                print "value2 ", value2
                df.loc[ tips[cat2] == value2 ].plot(kind="scatter", x="total_bill", y="tip",
                                                ax=self.axes[i], c=colors[j], label=value2)
        self.axes[i].legend()
        self.fig.canvas.draw_idle()


if __name__ == '__main__':
    app = QtGui.QApplication(sys.argv)
    win = MainWindow()
    sys.exit(app.exec_())
关于 pyqtgraph 的最后一句话是:我不认为pyqtgraph是PyQt的包装器,而是更多的扩展。尽管pyqtgraph附带了自己的Qt (这使得它可以移植,并且可以开箱即用),但它也是一个可以在PyQt中使用的包。因此,您可以简单地通过以下方式将GraphicsLayoutWidget添加到PyQt布局中
self.pgcanvas = pg.GraphicsLayoutWidget()
self.layout().addWidget(self.pgcanvas)
MatplotlibWidget (mw = pg.MatplotlibWidget())也是如此。虽然您可以使用这种小部件,但它只是一个方便的包装器,因为它所做的只是找到正确的matplotlib导入,并创建一个Figure和一个FigureCanvas实例。除非您使用其他pyqtgraph功能,否则只为了节省5行代码而导入完整的pyqtgraph包对我来说似乎有点过分。
Stack Overflow用户
发布于 2019-11-21 15:23:27
以下是可接受的答案的确切副本,但使用PYQT5
from PyQt5 import QtCore, QtGui, QtWidgets
from matplotlib.backends.backend_qt5agg import FigureCanvasQTAgg as FigureCanvas
from matplotlib.figure import Figure
import sys
import seaborn as sns

tips = sns.load_dataset("tips")

class MainWindow(QtWidgets.QMainWindow):
    send_fig = QtCore.pyqtSignal(str)

    def __init__(self):
        super(MainWindow, self).__init__()

        self.main_widget = QtWidgets.QWidget(self)

        self.fig = Figure()
        self.ax1 = self.fig.add_subplot(121)
        self.ax2 = self.fig.add_subplot(122, sharex=self.ax1, sharey=self.ax1)
        self.axes=[self.ax1, self.ax2]
        self.canvas = FigureCanvas(self.fig)

        self.canvas.setSizePolicy(QtWidgets.QSizePolicy.Expanding,
                                  QtWidgets.QSizePolicy.Expanding)
        self.canvas.updateGeometry()

        self.dropdown1 = QtWidgets.QComboBox()
        self.dropdown1.addItems(["sex", "time", "smoker"])
        self.dropdown2 = QtWidgets.QComboBox()
        self.dropdown2.addItems(["sex", "time", "smoker", "day"])
        self.dropdown2.setCurrentIndex(2)

        self.dropdown1.currentIndexChanged.connect(self.update)
        self.dropdown2.currentIndexChanged.connect(self.update)
        self.label = QtWidgets.QLabel("A plot:")

        self.layout = QtWidgets.QGridLayout(self.main_widget)
        self.layout.addWidget(QtWidgets.QLabel("Select category for subplots"))
        self.layout.addWidget(self.dropdown1)
        self.layout.addWidget(QtWidgets.QLabel("Select category for markers"))
        self.layout.addWidget(self.dropdown2)

        self.layout.addWidget(self.canvas)

        self.setCentralWidget(self.main_widget)
        self.show()
        self.update()

    def update(self):

        colors=["b", "r", "g", "y", "k", "c"]
        self.ax1.clear()
        self.ax2.clear()
        cat1 = self.dropdown1.currentText()
        cat2 = self.dropdown2.currentText()
        print (cat1, cat2)

        for i, value in enumerate(tips[cat1].unique().get_values()):
            print ("value ", value)
            df = tips.loc[tips[cat1] == value]
            self.axes[i].set_title(cat1 + ": " + value)
            for j, value2 in enumerate(df[cat2].unique().get_values()):
                print ("value2 ", value2)
                df.loc[ tips[cat2] == value2 ].plot(kind="scatter", x="total_bill", y="tip",
                                                ax=self.axes[i], c=colors[j], label=value2)
        self.axes[i].legend()
        self.fig.canvas.draw_idle()


if __name__ == '__main__':
    import sys
    app = QtWidgets.QApplication(sys.argv)
    ex = MainWindow()
    sys.exit(app.exec_())
虽然任何matplotlib图都可以以同样的方式嵌入到pyqt5中,但重要的是要注意,随着数据集大小的增加,UI可能会变慢。但是,我发现通过使用regex功能来解析和绘制日志文件非常方便。
https://stackoverflow.com/questions/41671867
复制相似问题
腾讯云开发者

Copyright © 2013 - 2026 Tencent Cloud. All Rights Reserved. 腾讯云 版权所有
深圳市腾讯计算机系统有限公司 ICP备案/许可证号:粤B2-20090059 ![]() 粤公网安备44030502008569号
粤公网安备44030502008569号
腾讯云计算(北京)有限责任公司 京ICP证150476号 | 京ICP备11018762号