
用闪亮的列名过滤雷达图表
用闪亮的列名过滤雷达图表
提问于 2020-11-12 23:46:02
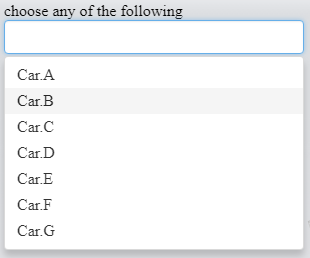
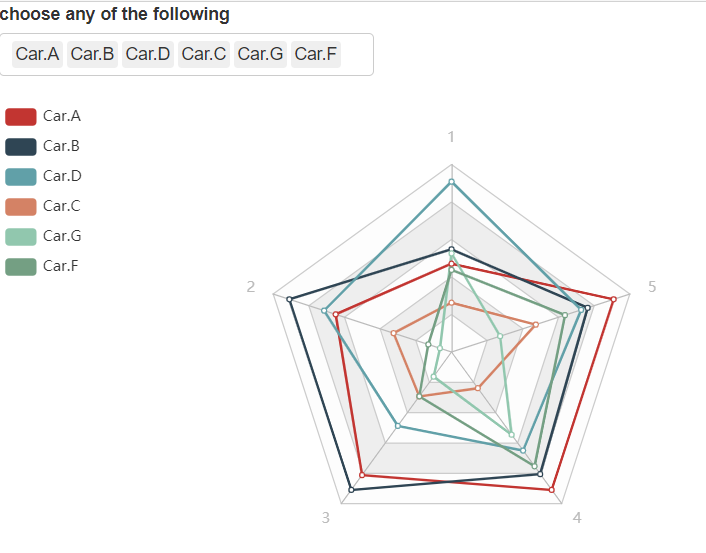
由于下面的代码,我可以在雷达图上显示7辆汽车(A到G)的特性,单击图表左侧的复选框,选择要显示的汽车数量:
   if (interactive()) {
  library(shiny)
  library(ECharts2Shiny)


  dat <- data.frame(Car.A = c(4300, 10000, 25000, 35000, 50000),
                    Car.B = c(5000, 14000, 28000, 31000, 42000),
                    Car.C = c(2400, 5000, 9020, 9200, 26000),
                    Car.D = c(8300, 11000, 15000,25000, 40000),
                    Car.E = c(23000, 14000, 28000, 31000, 42000),
                    Car.F = c(4000, 2000, 9000, 29000, 35000),
                    Car.G = c(4800, 1000, 5000, 21000, 15000))
  row.names(dat) <- c("Feture 1", "Feature 2", "Feature 3", "Feature 4", "Feature 5")


  # Server function -------------------------------------------
  server <- function(input, output) {
    renderRadarChart(div_id = "test",
                     data = dat)
  }

  # UI layout -------------------------------------------------


  ui <-
    fluidRow(
      column(width = 3,

             box(width = NULL,  selectInput("variable", "choose any of the following", names(dat), multiple=TRUE)
             )),


  column(width = 5,
         box(width = NULL,
             loadEChartsLibrary(),

             tags$div(id="test", style="width:100%;height:400px;"),
             deliverChart(div_id = "test")
         ))

  )


  # Run the application --------------------------------------
  shinyApp(ui = ui, server = server)
}
# }
但是这个选项不适合我,我宁愿使用select列表输入控件来代替:
 # Server function -------------------------------------------
  server <- function(input, output) {


    renderRadarChart(div_id = "test",
                     dat %>% dplyr::select(!!!input$variable)
    )

  }


 # UI layout -------------------------------------------------
    ui <-
        fluidRow(
            column(width = 3,

                   box(width = NULL,  selectInput("variable", "choose any of the following", names(dat), multiple=TRUE)
                   )),


            column(width = 5,
                   box(width = NULL,
                       loadEChartsLibrary(),

                       tags$div(id="test", style="width:100%;height:400px;"),
                       deliverChart(div_id = "test")
                   ))

        )
但不幸的是,此筛选器选项不起作用,我只能得到以下错误消息:
错误:仅在具有所有数值变量的数据帧上定义
我做错什么了?
回答 1
Stack Overflow用户
回答已采纳
发布于 2020-11-13 02:32:18
对服务器代码的小调整将解决错误。尝尝这个
# Server function -------------------------------------------
server <- function(input, output) {
  observe({
    req(input$variable)

    data <- dat %>% dplyr::select(!!!input$variable)
    renderRadarChart(div_id = "test",data)

  })

}
页面原文内容由Stack Overflow提供。腾讯云小微IT领域专用引擎提供翻译支持
原文链接:
https://stackoverflow.com/questions/64813501
复制相关文章
相似问题
腾讯云开发者

Copyright © 2013 - 2026 Tencent Cloud. All Rights Reserved. 腾讯云 版权所有
深圳市腾讯计算机系统有限公司 ICP备案/许可证号:粤B2-20090059 ![]() 粤公网安备44030502008569号
粤公网安备44030502008569号
腾讯云计算(北京)有限责任公司 京ICP证150476号 | 京ICP备11018762号