git的rebase和merge有什么区别,两张图带你搞明白
原创

一、介绍
你是否也搞不懂git rebase和git merge这两者命令之间的区别。
两个命令都可以作为将两个分支合并的命令,其内部实现还是有区别的。
我们得要学习这种差异,以便在合理的代码环境挑选这两个命令,以便我们更好的去使用git。
在讲解之前,默认你懂得了git commit;
不过这里还是简单说一下,每一次提交都代表一个节点,意味着代码发生变化的时机。
带着这种理解,我们好进行下面的讲解
二、git merge
如下图,图片中每一个节点都代表着一个commit,他们从下往上看,直到最新。
图片最左边代表着,B分支从A分支拉出来的一个时间节点,在commit C提交后拉出的B分支
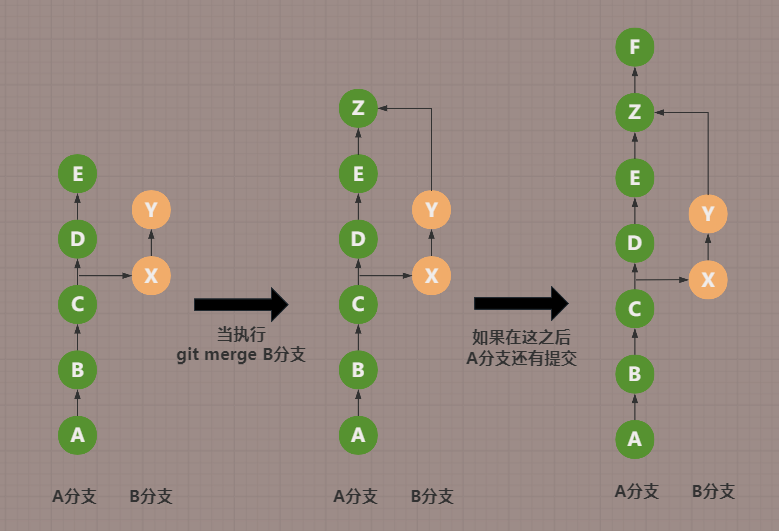
image-20240908161604099
当我们处于A分支时,执行git merge B分支会发生什么事情呢?
可以看到图片中间,相当于将commit X、commit Y两次提交,作为了新的commit Z提交到了A分支上
上图中这个新的commit Z提交节点,也被称为合并提交点
这就代表着B分支代码的提交已经合并到了A分支上,简单明了
如果后面A分支要是还有提交,那就如上面图片右边展示的那样,最新的提交在最上方。
三、git rebase
讲完了git merge,来讲讲git rebase,它就相当于插队,如下图
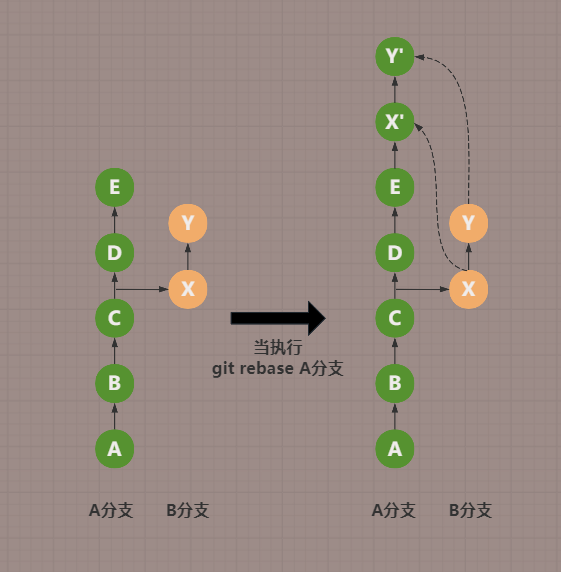
image-20240908165131971
可以看到,处于B分支,在执行完git rebase A分支后,
B分支的两个提交节点,已经跑到了A分支的头部,代表了合并成功
那我为什么还要在新的节点命名上加上一个'呢,变成了X'和Y',而且连线都用虚线来表达
是这样的,因为两个分支的X和X'虽然提交的代码一样,但提交的时间信息,提交的hash值都是不同的
这就像去从B分支那边复制了两个commit节点,粘贴到了A分支最新的位置上,
所以当我们查看X'时,我们并不能溯源它真正提交的信息,它已经确确实实的创建在了A分支上,就和原生的一样。
四、最后
最后,列一个表格,展示一下他们之间的差异
git merge | git rebase | |
|---|---|---|
特点 | 合并分支将展示完整的commit历史记录 | 会丢失commit节点源信息,合并日志是单线性的 |
缺点 | 分支多了,日志会比较繁琐 | 无法溯源 |
使用场景 | 如果我们是多人协同开发同个分支,建议使用merge | 如果是私有分支,使用rebase即可 |
原创声明:本文系作者授权腾讯云开发者社区发表,未经许可,不得转载。
如有侵权,请联系 cloudcommunity@tencent.com 删除。
原创声明:本文系作者授权腾讯云开发者社区发表,未经许可,不得转载。
如有侵权,请联系 cloudcommunity@tencent.com 删除。
评论
登录后参与评论
推荐阅读
目录
腾讯云开发者

Copyright © 2013 - 2026 Tencent Cloud. All Rights Reserved. 腾讯云 版权所有
深圳市腾讯计算机系统有限公司 ICP备案/许可证号:粤B2-20090059 ![]() 粤公网安备44030502008569号
粤公网安备44030502008569号
腾讯云计算(北京)有限责任公司 京ICP证150476号 | 京ICP备11018762号