Webman Push 推送案例之实时动态图表


服务端
在process目录下新建自定义进程 PushProcess.php
<?php
/**
 * @desc PushProcess
 * @author Tinywan(ShaoBo Wan)
 * @email 756684177@qq.com
 * @date 2024/1/12 9:17
 */

declare(strict_types=1);

namespace process;


use Workerman\Timer;

class PushProcess
{
    public function onWorkerStart()
    {
        Timer::add(1, function(){
            $api = new \Webman\Push\Api(
                config('plugin.webman.push.app.api'),
                config('plugin.webman.push.app.app_key'),
                config('plugin.webman.push.app.app_secret')
            );
            $api->trigger(['price-btcusd'], 'new-price', [
                'value' => rand(0, 5000)
            ]);
        });
    }
}
在
config/process.php中添加如下配置
// push
'push_chart'  => [
    'handler'  => \process\PushProcess::class
],
客户端
1、在webman2024/app/controller新建chartsPush方法
public function push(Request $request)
{
    return view('index/charts_push');
}
2、在webman2024/app/view/index目录新建charts_push.html
<!DOCTYPE html>
<html lang="en">
<head>
<meta charset="UTF-8">
<title>Webman Push推送案例之实时动态图表</title>
</head>
<body>
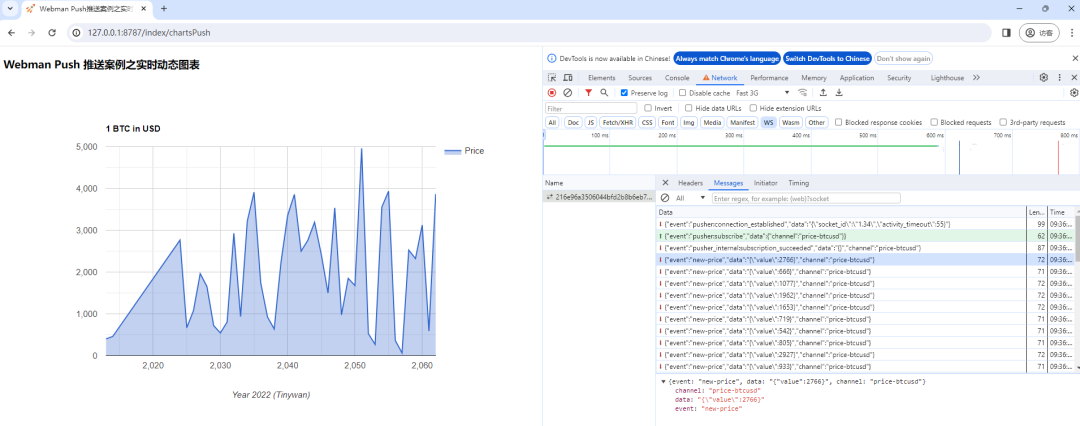
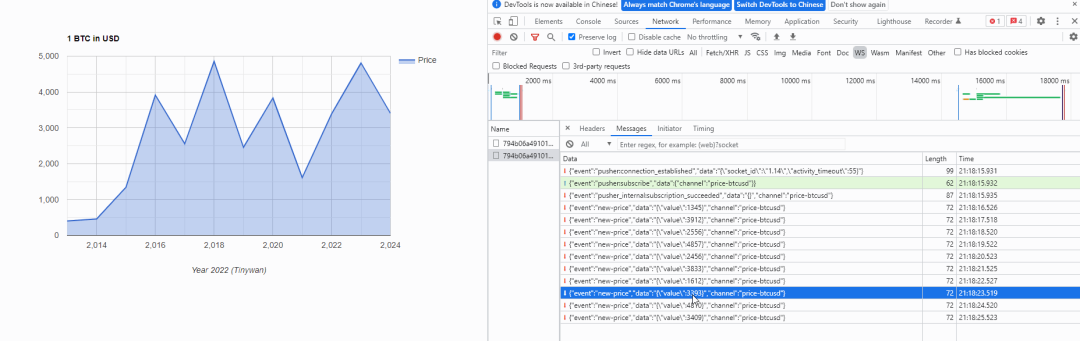
<h3>Webman Push 推送案例之实时动态图表</h3>
<div id="chart_div" style="width: 100%; height: 600px; margin: 0px;"></div>
<script src="https://cdnjs.cloudflare.com/ajax/libs/jquery/3.3.1/jquery.min.js"></script>
<script src="https://www.gstatic.com/charts/loader.js"></script>
<script src="/plugin/webman/push/push.js"> </script>
<script>
google.charts.load("current", { packages: ["corechart"] });
google.charts.setOnLoadCallback(() => {
// Instead of hard-coding the initial table data,
// you could fetch it from your server.
const dataTable = google.visualization.arrayToDataTable([
["Year", "Price"],
[2013, 400],
[2014, 460],
]);
const chart = new google.visualization.AreaChart(
document.getElementById("chart_div")
);
const options = {
title: "1 BTC in USD",
hAxis: { title: "Year 2022 (Tinywan)", titleTextStyle: { color: "#333" } },
vAxis: { minValue: 0 },
animation: { duration: 100, easing: "out" },
};
chart.draw(dataTable, options);
let year = 2024;
// (1) 创建实例
const pusher = new Push({
url: 'ws://127.0.0.1:8788', // websocket地址
app_key: '216e96a3506044bfd2b8b6eb7c492d32'
});
const channel = pusher.subscribe("price-btcusd");
channel.on('new-price', function(data) {
const row = [year++, data.value];
dataTable.addRow(row);
chart.draw(dataTable, options);
});
});
</script>
</body>
</html>
效果
本文参与 腾讯云自媒体同步曝光计划,分享自微信公众号。
原始发表:2024-01-12,如有侵权请联系 cloudcommunity@tencent.com 删除
评论
登录后参与评论
推荐阅读
目录
腾讯云开发者

Copyright © 2013 - 2026 Tencent Cloud. All Rights Reserved. 腾讯云 版权所有
深圳市腾讯计算机系统有限公司 ICP备案/许可证号:粤B2-20090059 ![]() 粤公网安备44030502008569号
粤公网安备44030502008569号
腾讯云计算(北京)有限责任公司 京ICP证150476号 | 京ICP备11018762号