Fluentd 是一个开源的数据收集器,旨在简化日志管理和分析的过程。它提供了一个统一的日志层,能够收集、转换并将数据发送到多种目的地。Fluentd 的设计哲学是提供简单、可靠和灵活的日志管理解决方案,使得它能够轻松地与各种数据源和最终存储系统集成。
Fluentd 的核心特点包括其插件架构,这使得它能够通过安装不同的插件来支持广泛的输入/输出源,包括文件、日志、数据库和 HTTP 源等。此外,Fluentd 还支持数据的实时处理,包括过滤、修改和丰富数据,以满足特定的日志管理需求。
使用 Fluentd 可以帮助组织减少日志管理的复杂性,提高数据处理的效率,便于日志数据的分析和监控。无论是在云环境还是在本地部署,Fluentd 都能提供灵活的日志管理解决方案,帮助企业更好地理解和利用他们的数据。
Fluentd 和 Fluent Bit 都可以用作聚合器或转发器,它们可以相互补充或用作独立解决方案。近年来,出于性能和兼容性原因,云提供商从 Fluentd 转向 Fluent Bit。Fluent Bit 现在被认为是下一代解决方案。
本文将为您介绍各类部署方式部署的 Fluentd 组件如何暴露 Prometheus 指标数据,并通过腾讯云可观测平台-Prometheus监控服务来采集指标并展示数据。Prometheus 监控服务支持提供预设的 Fluentd 监控面板,以方便您使用。
Fluentd
Fluentd 部署方式
Fluentd 在云环境下部署有很多方式,本文将介绍基于以下四种部署方式进行监控接入:
Fluentd 镜像自定义部署
部署流程
1. 获取或者自制安装符合业务使用插件的 Fluentd 镜像。
2. 创建 Fluentd 配置,进行输入、过滤、输出等插件的配置。
3. 使用 Fluentd 配置和镜像创建 Fluentd 负载。
4. 查看 Fluentd 运行情况。
指标导出
方式一:Prometheus 插件导出(推荐)
1. Fluentd 官方镜像是没有 Prometheus 插件的,需要安装,您可以使用以下 Dockerfile,来输出包含 Prometheus 插件 的 Fluentd 镜像。
FROM fluent/fluentd:latestRUN fluent-gem install fluent-plugin-prometheus## 对于 td-agent:## RUN td-agent-gem install fluent-plugin-prometheus
若您已经有 DockerFile,则在其中加入安装 fluent-plugin-prometheus 插件命令即可。
RUN fluent-gem install fluent-plugin-prometheus## 对于 td-agent:## RUN td-agent-gem install fluent-plugin-prometheus
2. 登录 腾讯云容器服务,单击集群名称/ID 进入您的集群,在配置管理中找到您的 Fluentd 配置,在其中添加 prometheus 相关输入插件,导出 prometheus 指标。
# expose metrics in prometheus format<source>@type prometheusbind 0.0.0.0port 24231metrics_path /metrics</source><source>@type prometheus_output_monitorinterval 10@id in_prometheus_output_monitor</source>
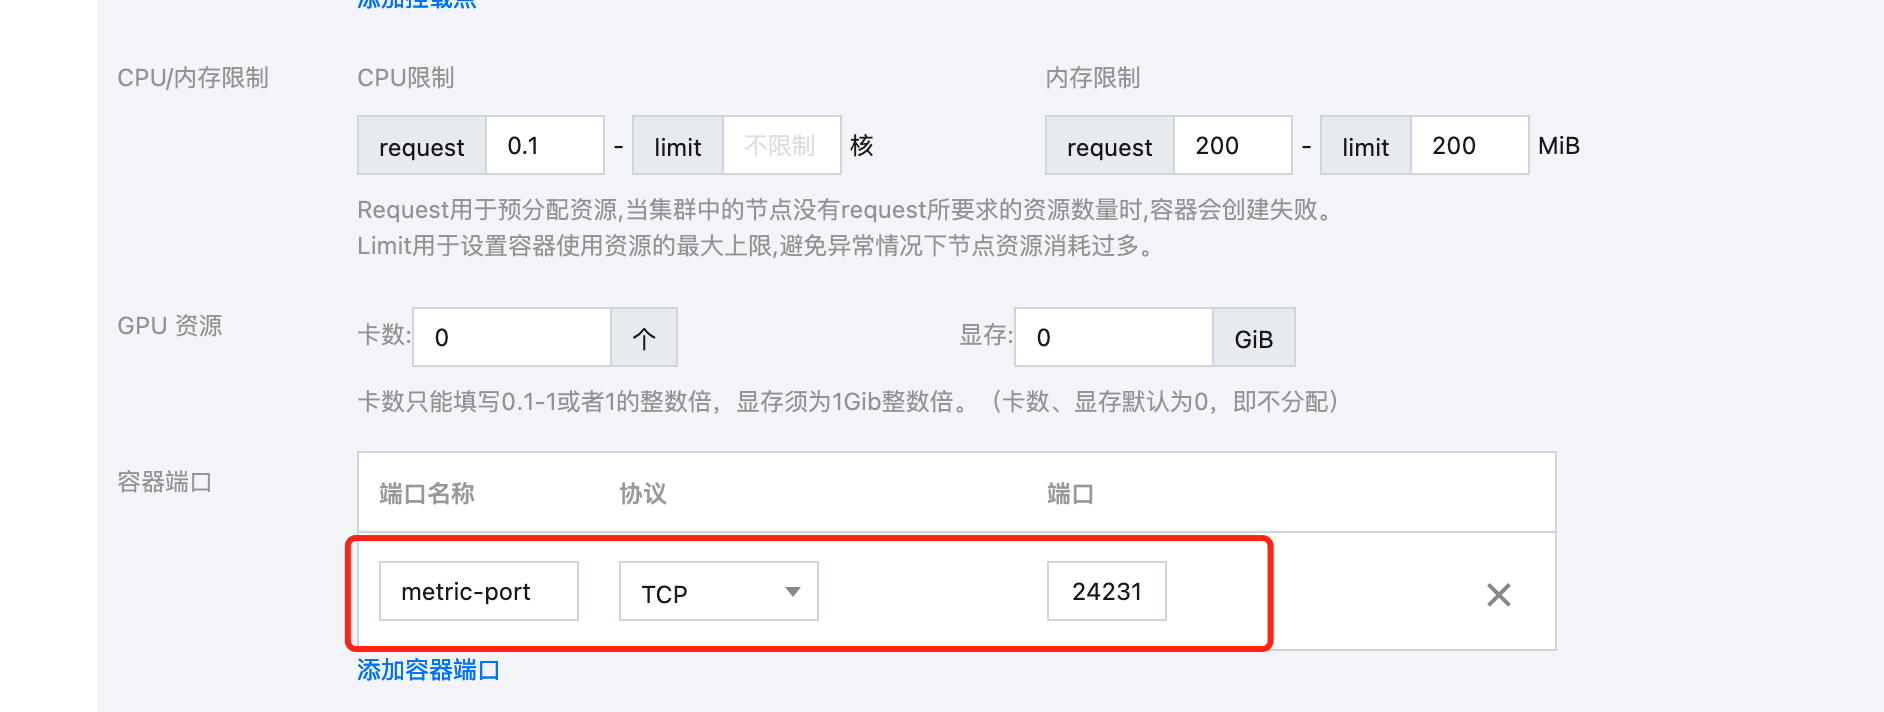
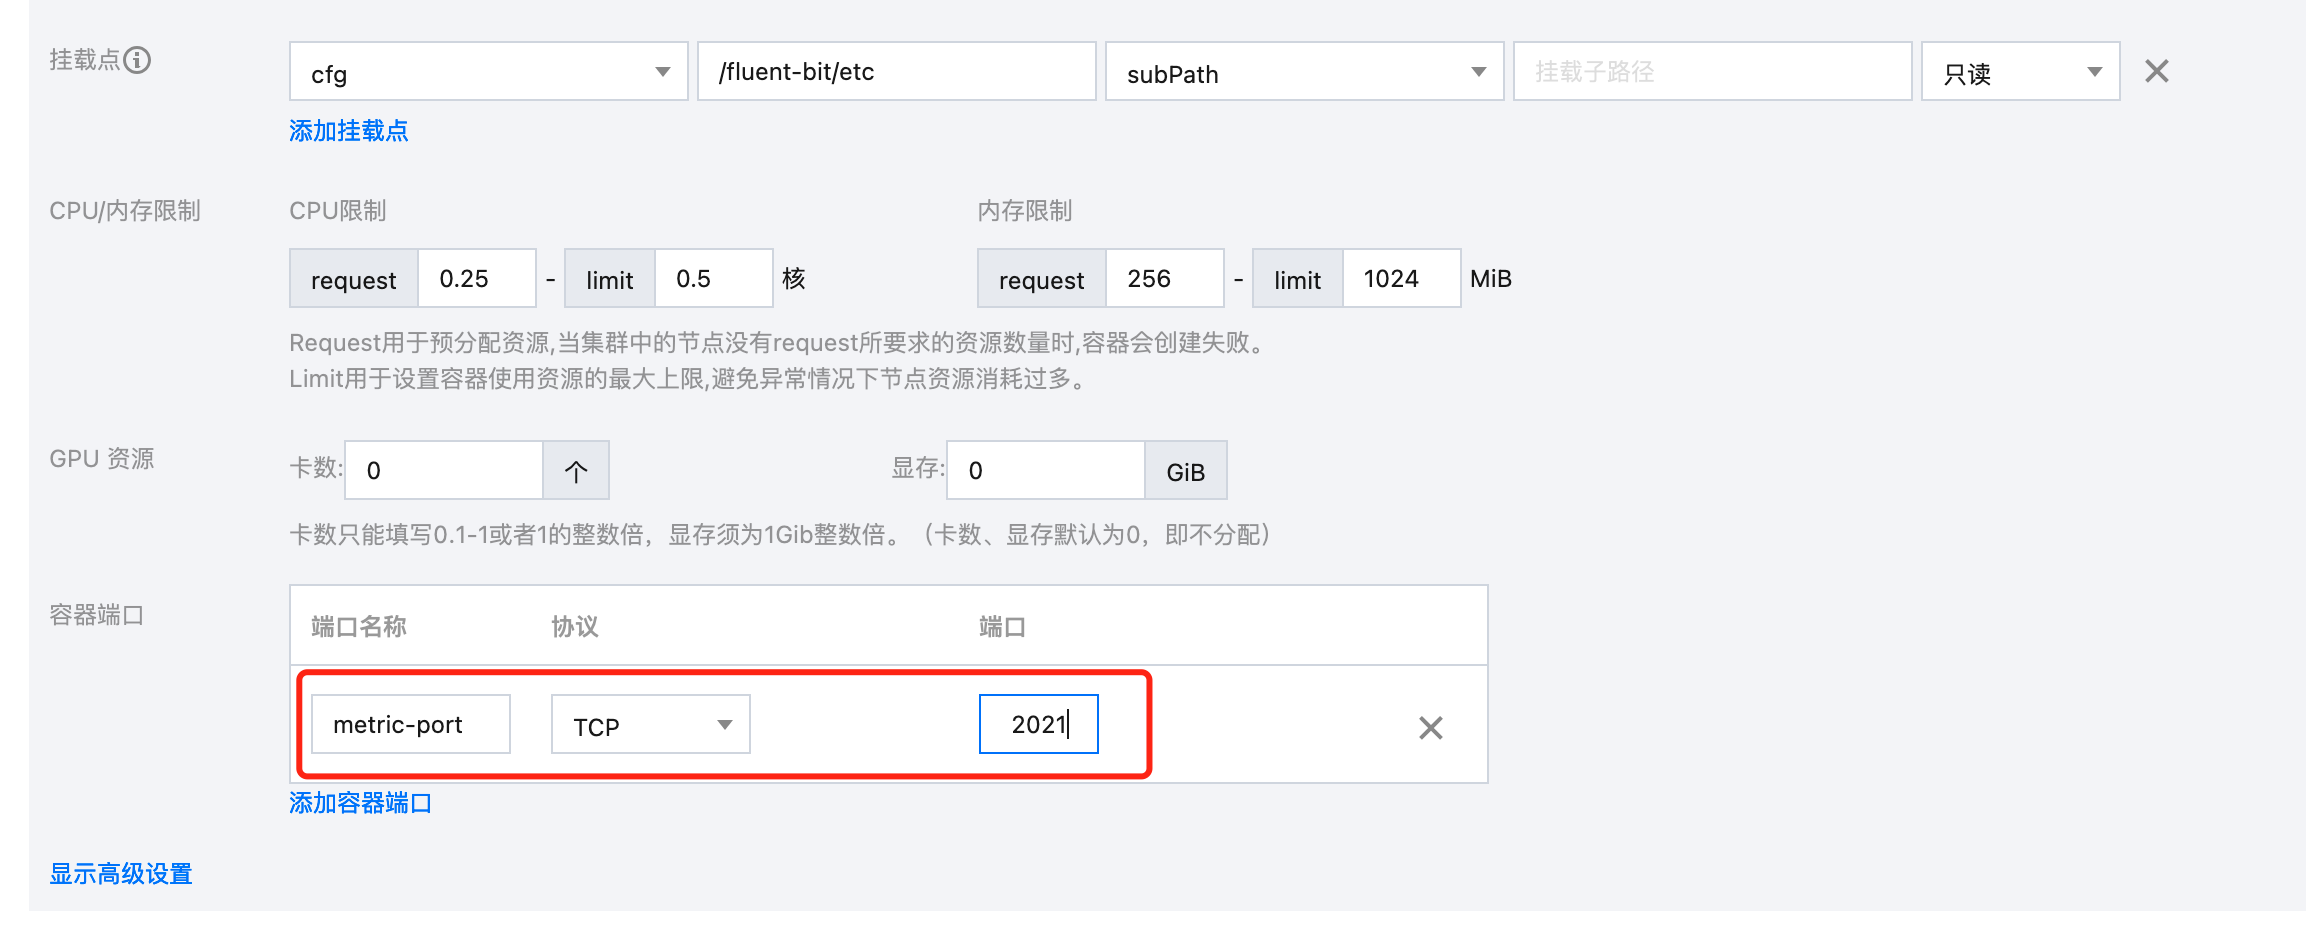
3. 在工作负载中找到您的 Fluentd 负载,更新镜像为第一步中输出的镜像,然后再给 Pod 添加容器端口,该容器端口名称会在 PodMonitor 采集中使用。
方式二:Exporter 导出
1. 登录 腾讯云容器服务,单击集群名称/ID 进入您的集群,在配置管理中找到您的 Fluentd 配置,在其中添加 monitor-agent 相关输入插件,导出监控数据。
<source>@type monitor_agentbind 0.0.0.0port 24220</source>
2. 部署 fluentd-exporter 导出 prometheus 指标。
apiVersion: apps/v1kind: Deploymentmetadata:labels:app.kubernetes.io/instance: fluentd-demo # 根据业务需要调整成对应的名称,建议加上 Fluentd 实例的信息app.kubernetes.io/name: fluentd-exportername: fluentd-demo-fluentd-exporter # 根据业务需要调整成对应的名称,建议加上 Fluentd 实例的信息,namespace: cm-prometheus # 根据业务调整命名空间spec:replicas: 1selector:matchLabels:app.kubernetes.io/instance: fluentd-testapp.kubernetes.io/name: fluentd-exporterstrategy:rollingUpdate:maxSurge: 25%maxUnavailable: 25%type: RollingUpdatetemplate:metadata:labels:app.kubernetes.io/instance: fluentd-demo # 根据业务需要调整成对应的名称,建议加上 fluentd 实例的信息app.kubernetes.io/job: fluentd-demoapp.kubernetes.io/name: fluentd-exporterspec:containers:- args:- --telemetry.address=:8080 ## 指标开放到 8080端口- --scrape_uri=http://172.0.0.1:24220/api/plugins.json ## 地址使用 Fluentd pod 实例 IPimage: ccr.ccs.tencentyun.com/rig-agent/common-image:fluentd_exporter-latestimagePullPolicy: IfNotPresentname: fluentd-exporterports:- containerPort: 8080name: metric-port # 这个名称在配置抓取任务的时候需要protocol: TCPresources: {}terminationMessagePath: /dev/termination-logterminationMessagePolicy: FilednsPolicy: ClusterFirstrestartPolicy: AlwaysschedulerName: default-schedulersecurityContext: {}terminationGracePeriodSeconds: 30
Fluentd Daemonset 镜像部署
部署流程
根据实际业务使用相应的 fluentd-k8s-daemonset,下面以输出到 elasticsearch 的 fluentd-daemonset-elasticsearch 为例,介绍其部署流程:
1. 在 fluentd-kubernetes-daemonset 项目的 配置生成模板目录 下找到配置文件的 erb 文件,根据业务进行配置的调整,然后生成各配置文件。或者使用 Docker 镜像目录 中已经生成出来的配置,根据业务调整得到最终配置。
2. 使用 fluentd-daemonset-elasticsearch.yaml(根据实际业务调整 host、端口、鉴权等信息)部署输出到 elasticsearch 的 fluentd。
3. 查看 fluentd 运行情况。
指标导出
Fluentd Daemonset 自带 Prometheus 插件,同时默认配置已进行 Prometheus 指标导出。
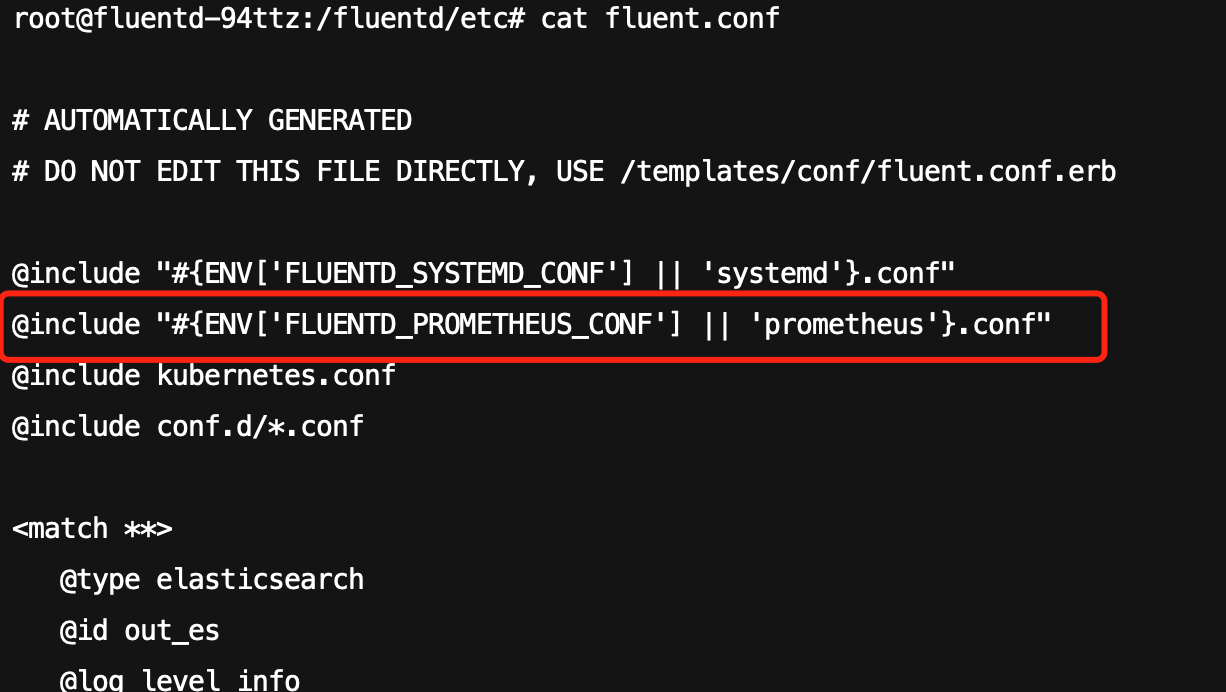
prometheus.conf 默认导出配置。
# AUTOMATICALLY GENERATED# DO NOT EDIT THIS FILE DIRECTLY, USE /templates/conf/prometheus.conf.erb# Prometheus metric exposed on 0.0.0.0:24231/metrics<source>@type prometheus@id in_prometheusbind "#{ENV['FLUENTD_PROMETHEUS_BIND'] || '0.0.0.0'}"port "#{ENV['FLUENTD_PROMETHEUS_PORT'] || '24231'}"metrics_path "#{ENV['FLUENTD_PROMETHEUS_PATH'] || '/metrics'}"</source><source>@type prometheus_output_monitor@id in_prometheus_output_monitor</source>
Fluentd Operator 部署管理
部署流程
1. 使用 Fluentd Operator 管理部署 Fluentd 之前需要先部署 Fluent Operator。部署方式有两种:一种为 yaml 部署,另一种为 helm 部署,详情请参见 开始安装。
2. 创建 ClusterInput、ClusterFilter、ClusterOutput CR 进行输入、输出、过滤配置。
3. 创建 ClusterFluentdConfig CR,将上述组件关联进来。
4. 挂载 ClusterFluentdConfig 创建 Fluentd CR,Operator 会根据 CR 创建出 Fluentd。
5. 查看 Fluentd 运行情况。
Fluentd 指标导出
由于目前 Fluentd Operator 只支持 Fluent Bit Prometheus 指标的导出,Fluentd 暂不支持,故而 Fluentd 需使用 Fluentd 镜像自定义部署指标导出。
Logging Operator 部署管理
部署流程
1. 使用 Logging Operator 管理部署 Fluentd 之前需要先部署 Logging Operator,详情请参见 示例。
2. 创建 FluentbitAgent CR,Operator 会根据该 CR 进行 Fluentd 部署。
3. 创建 Flow、Output CR,进行 Fluentd 配置。
4. 查看 Fluentd 运行情况。
指标导出
Logging Operator 与 Prometheus 有良好的适配性,在 Logging CR 添加如下配置即可导出指标。
spec:fluentdSpec:metrics:serviceMonitor: truefluentbitSpec:metrics:serviceMonitor: true
导出之后配置 ServiceMonitor 即可完成指标采集。
Fluent Bit
Fluent Bit 官方镜像本身就支持导出 Prometheus 指标能力,只需要按需开放即可。
镜像部署指标导出
方法一:HTTP Server 导出
1. 登录 腾讯云容器服务,单击集群名称/ID 进入您的集群,在配置管理中找到您的 Fluent Bit 配置,在其中添加如下配置:
[SERVICE]HTTP_Server On # 若存在 HTTP_Server,但状态为Off,需改为OnHTTP_Listen 0.0.0.0HTTP_PORT 2020 # 端口可自行调整[INPUT]Name cpu[OUTPUT]Name stdoutMatch *
2. Prometheus 指标导出验证。
curl -s http://172.0.0.1:2020/api/v2/metrics/prometheus
指标输出:
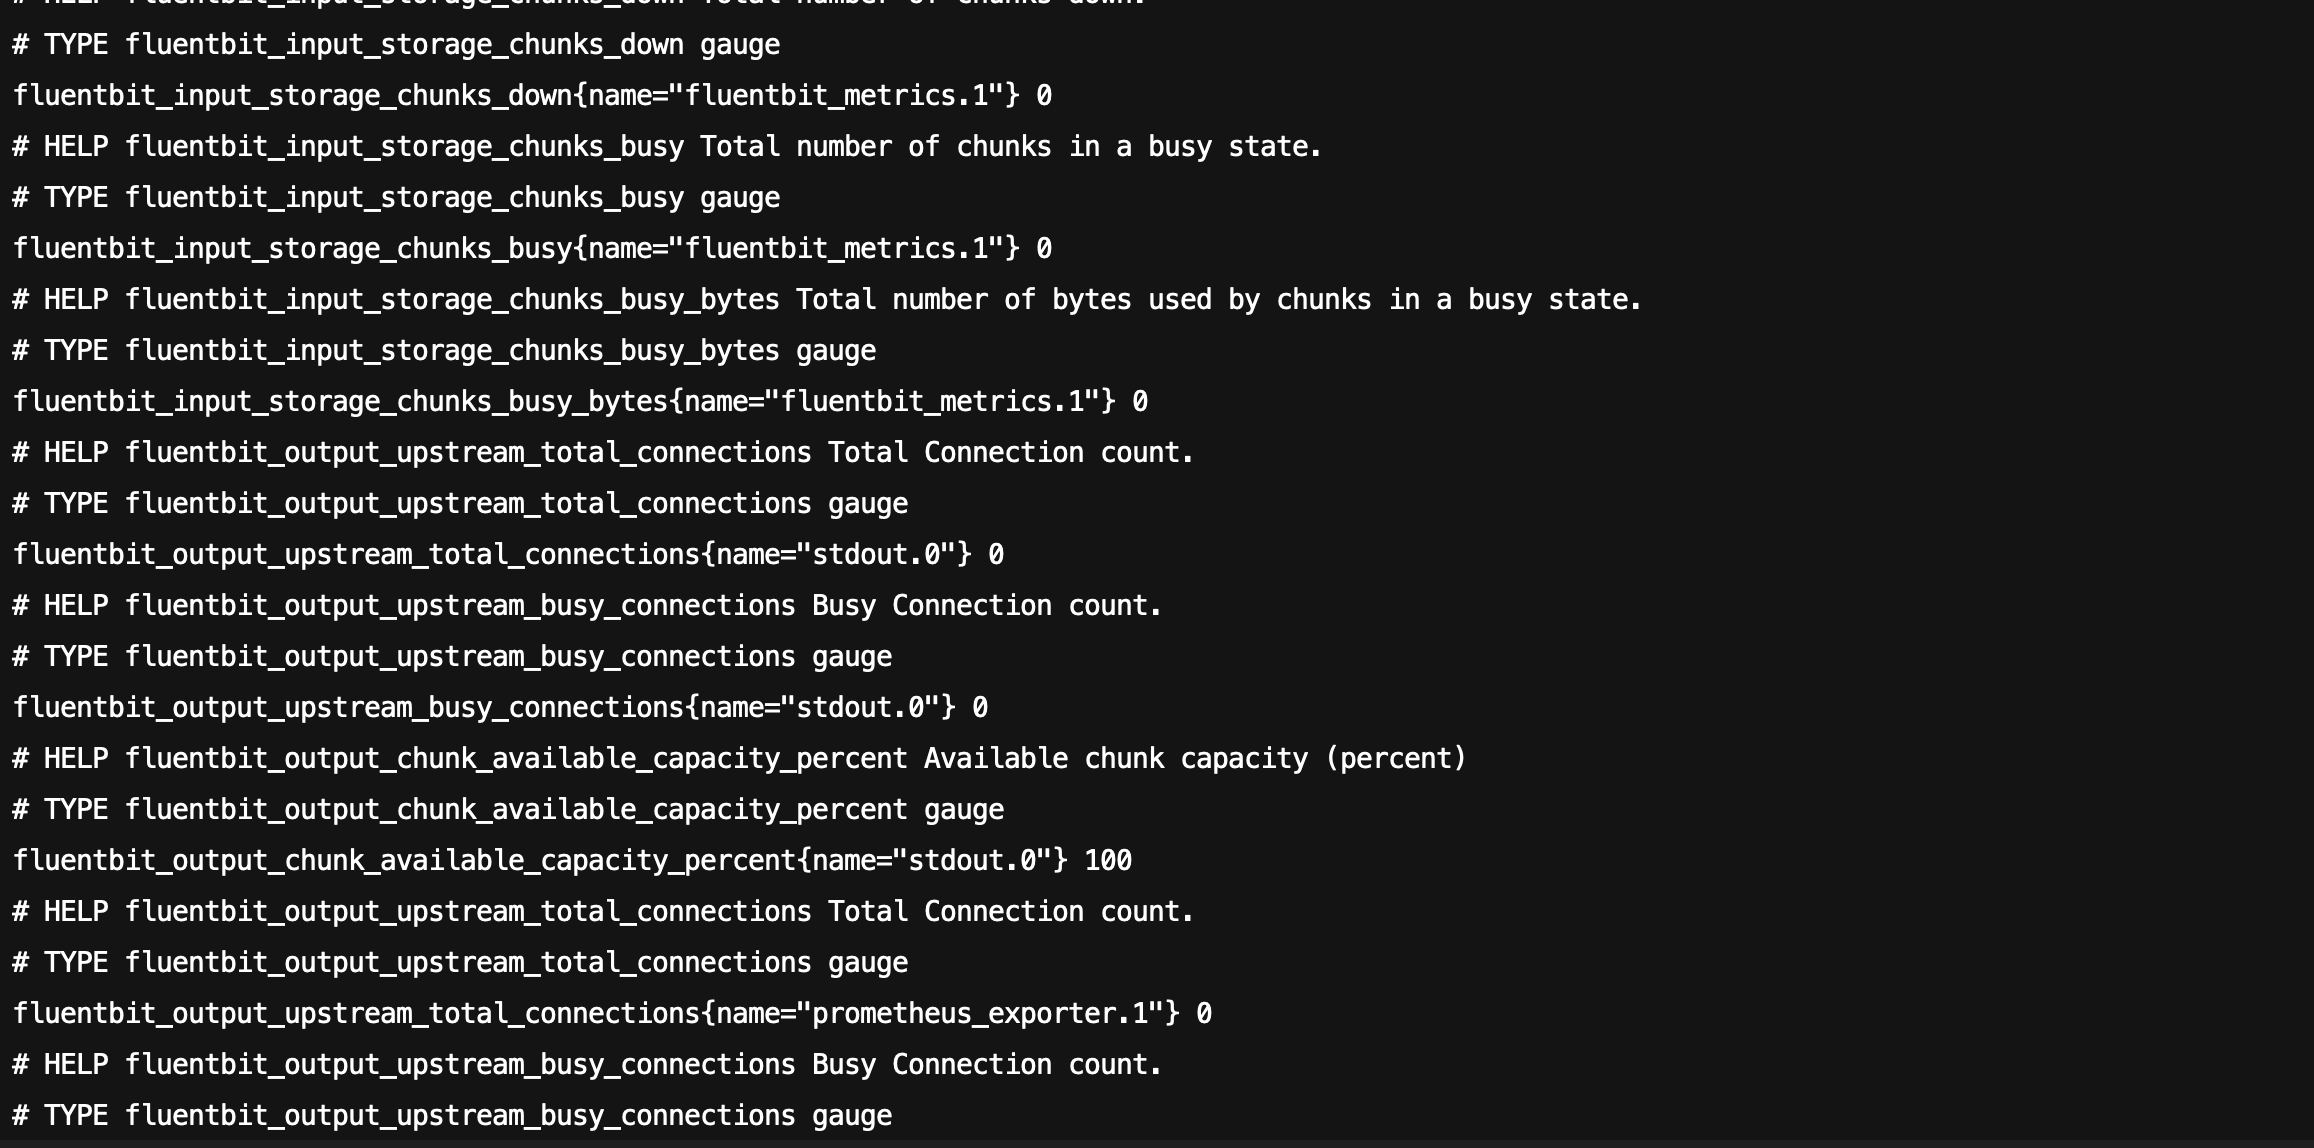
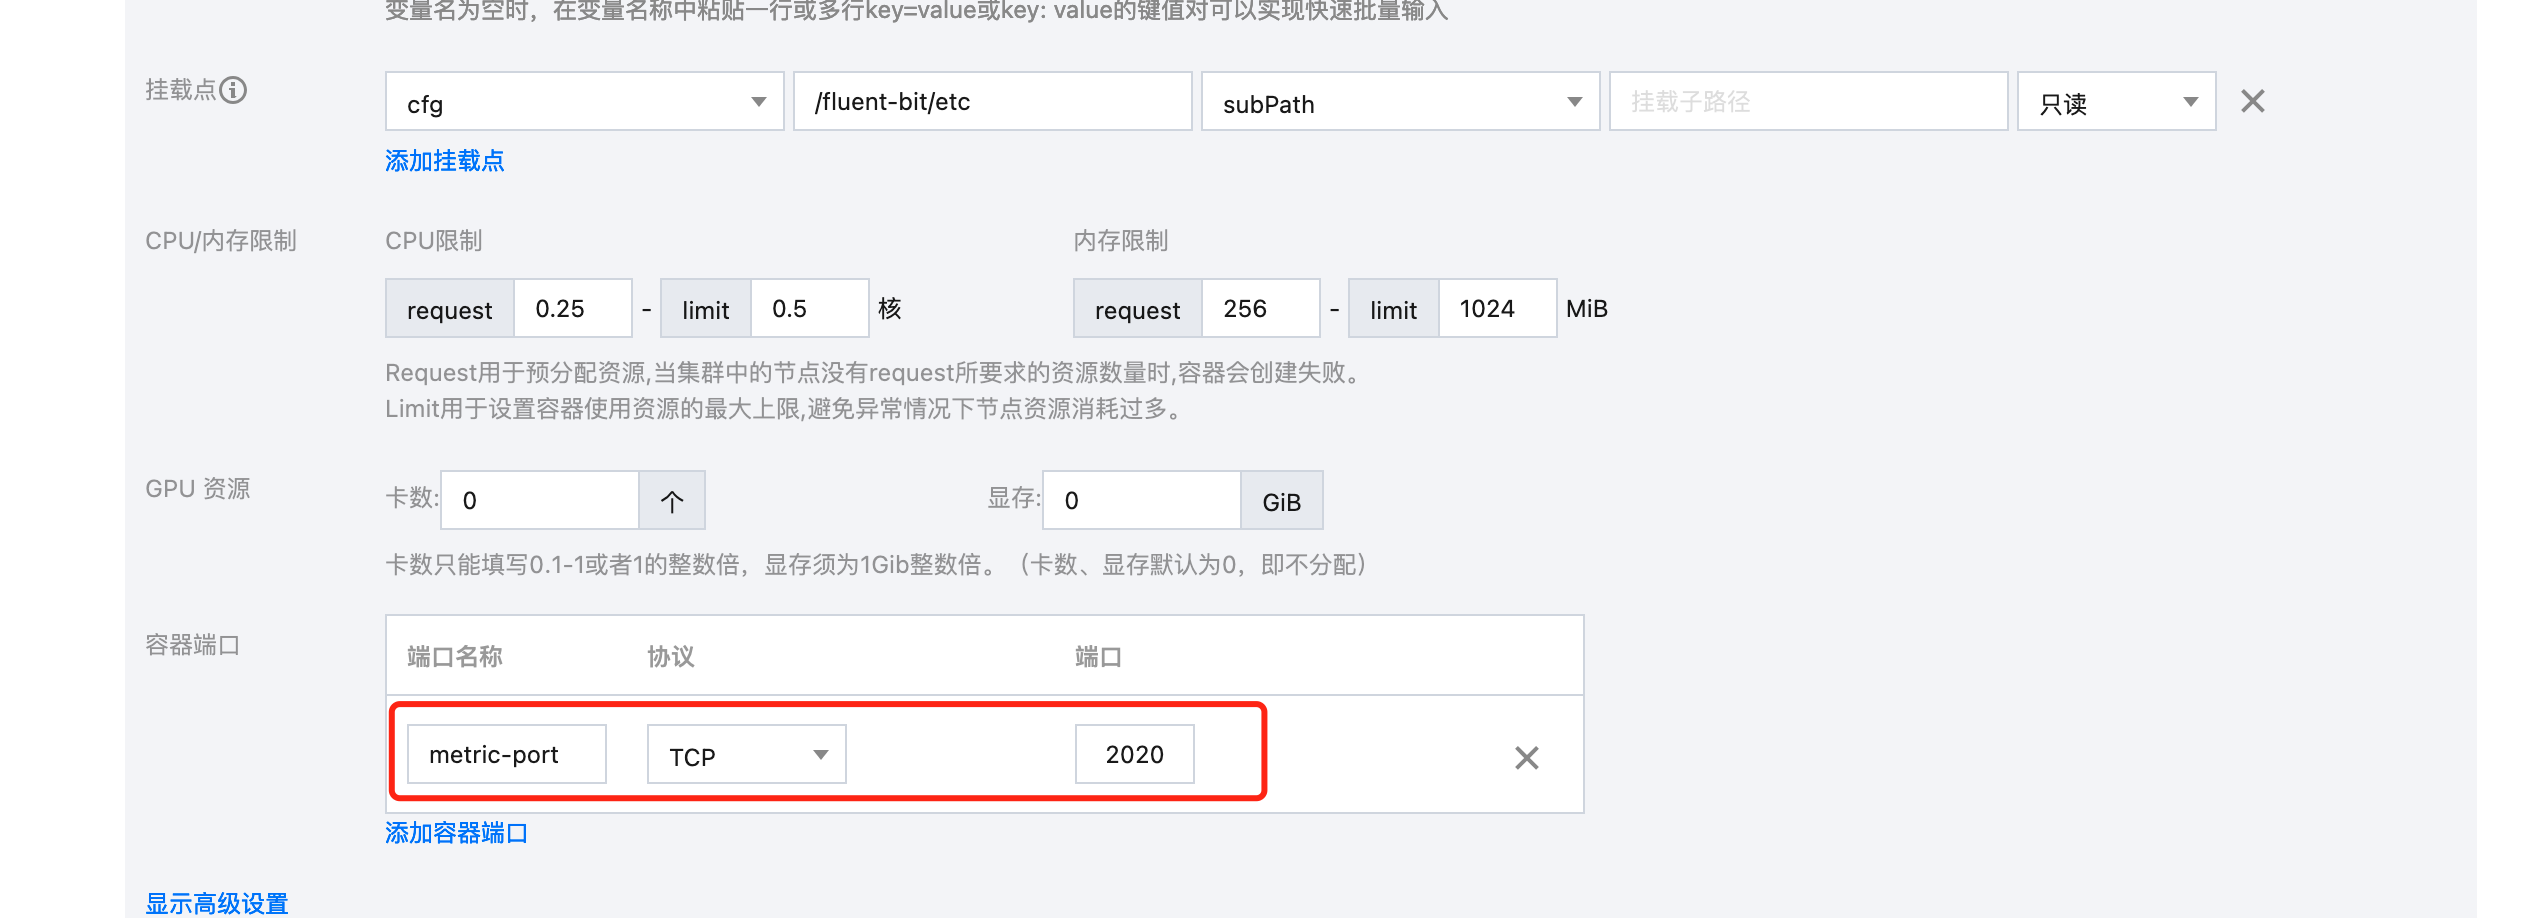
3. 在工作负载中找到您的 Fluent Bit 负载,给 Pod 添加容器端口,该容器端口名称会在 PodMonitor 采集中使用。
方法二:Fluent Bit Metrics 导出
1. 登录 腾讯云容器服务,单击集群名称/ID 进入您的集群,在配置管理中找到您的 Fluent Bit 配置,在其中添加如下配置:
[SERVICE]flush 1log_level info[INPUT]name fluentbit_metricstag internal_metricsscrape_interval 2[OUTPUT]name prometheus_exportermatch internal_metricshost 0.0.0.0port 2021
2. Prometheus 指标导出验证。
curl -s http://172.0.0.:2021/metrics
3. 在工作负载中找到您的 Fluent Bit 负载,给 Pod 添加容器端口,该容器端口名称会在 PodMonitor 采集中使用。
Fluentd Operator 部署指标导出
1. 登录 腾讯云容器服务,单击集群名称/ID 进入您的集群,添加如下 ClusterInput CR:
apiVersion: fluentbit.fluent.io/v1alpha2kind: ClusterInputmetadata:name: fluentbit_metricslabels:fluentbit.fluent.io/enabled: "true"fluentbit.fluent.io/mode: "fluentbit"spec:tag: internal_metricsscrape_interval: 2scrape_on_start: true
添加如下 ClusterOutput CR:
apiVersion: fluentbit.fluent.io/v1alpha2kind: ClusterOutputmetadata:name: prometheus-exporterlabels:fluentbit.fluent.io/enabled: "true"fluentbit.fluent.io/mode: "fluentbit"spec:match: internal_metricsmetricsExporter:host: "0.0.0.0"port: 2021addLabels:app: "fluentbit"
2. 将上述 CR Selector 到 ClusterFluentdConfig CR 中。
3. 在工作负载中找到您的 Fluent Bit 负载,给 Pod 添加容器端口,该容器端口名称会在 PodMonitor 采集中使用。

Logging Operator 部署指标导出
Logging Operator 与 Prometheus 有良好的适配性,在 Logging CR 添加如下配置即可导出指标。
spec:fluentdSpec:metrics:serviceMonitor: truefluentbitSpec:metrics:serviceMonitor: true
导出之后配置 ServiceMonitor 即可完成指标采集。
接入 Prometheus 监控
Podmonitor 采集(推荐)
在 Fluentd 存在动态扩缩容场景下,为了能够动态服务发现,需要使用 Podmonitor 来进行指标采集:
1. 登录 腾讯云可观测平台 > Prometheus 控制台,单击新建的实例 ID/名称。
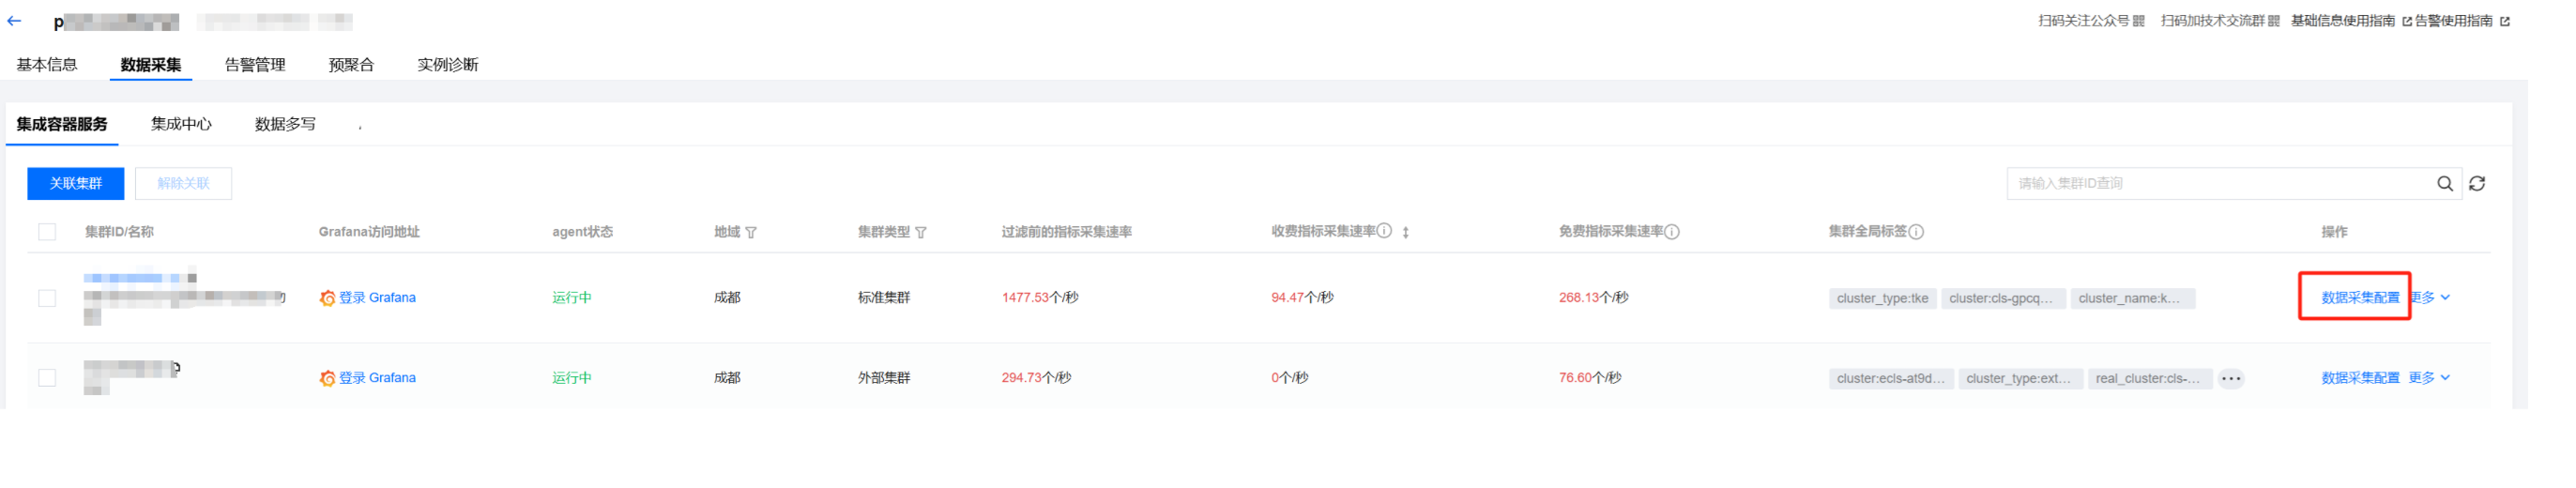
2. 在数据采集页面,选择集成容器服务,单击集群右侧的数据采集配置,如下图所示:

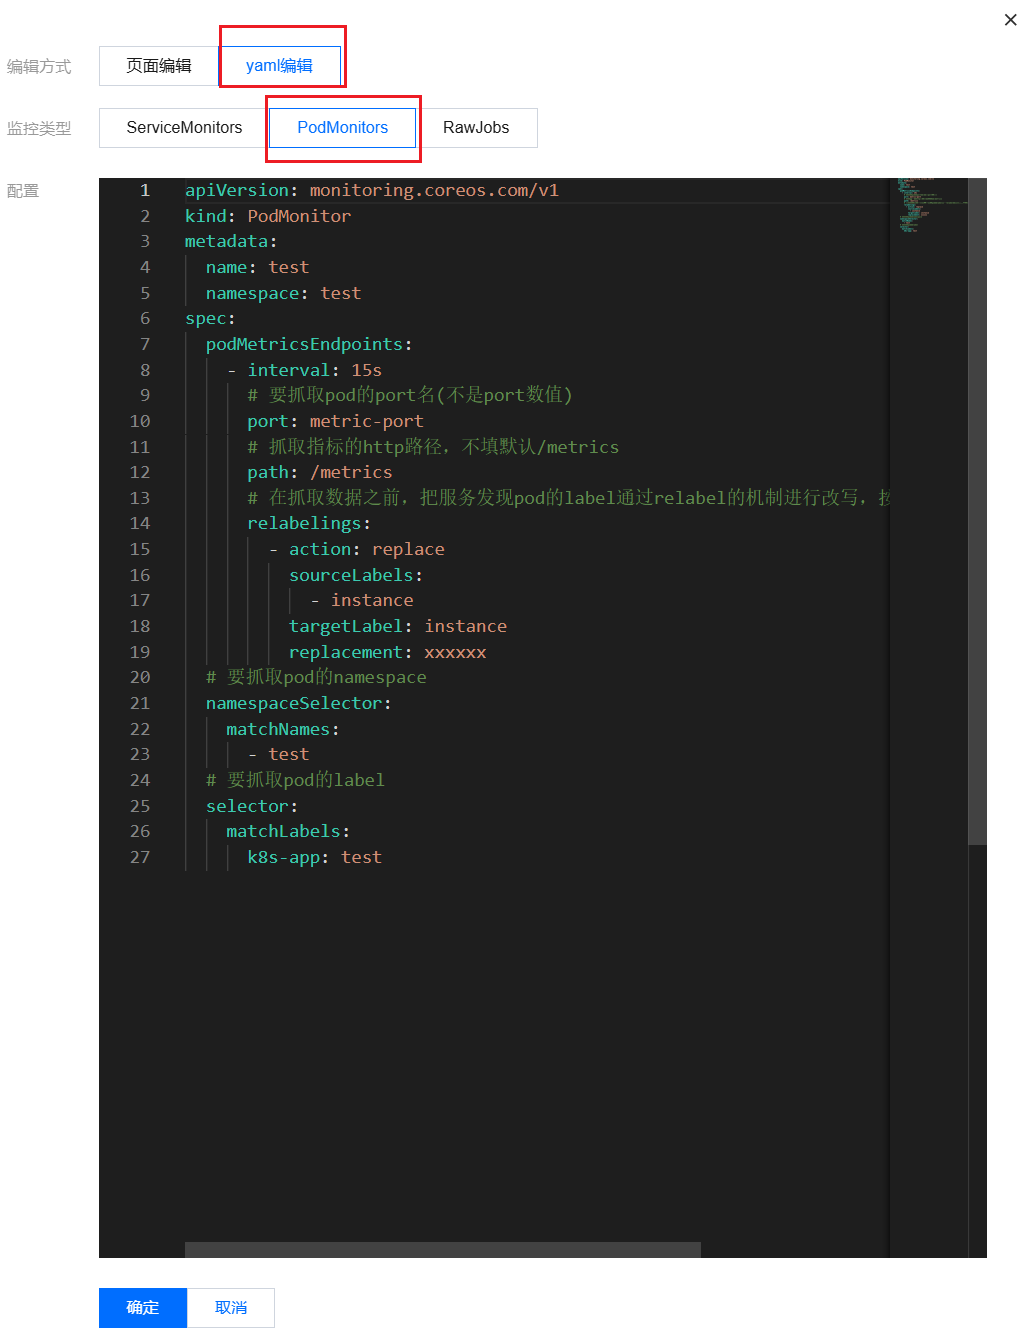
3. 进入数据采集配置页面后,单击新建自定义监控,在弹出的页面中选择 yaml编辑,监控类型选择 PodMonitors,如下图所示:
4. 通过此方式添加
Pod Monitor,目前支持基于 Labels 发现对应的目标实例地址,因此可以对一些负载添加特定的 K8S Labels,可以使 Labels 下负载的 Pod 都会被 Prometheus 服务自动识别出来,不需要再为每个服务添加采集任务,以上面的例子配置信息如下:说明:
port 的取值为 pod yaml 配置文件里的 spec/ports/name 对应的值。apiVersion: monitoring.coreos.com/v1kind: PodMonitormetadata:name: fluentd-demo # 填写一个唯一名称namespace: cm-prometheus # 根据业务调整命名空间spec:podMetricsEndpoints:- interval: 15s# 要抓取pod的port名(不是port数值)port: metric-port# 抓取指标的http路径,不填默认/metrics,Fluent Bit 方式一为 /api/v2/metrics/prometheuspath: /metrics# 在抓取数据之前,把服务发现pod的label通过relabel的机制进行改写,按顺序执行多个relabel规则# 根据业务实际使用进行配置,也可以不进行relabel配置relabelings:- action: replacesourceLabels:- instancetargetLabel: instancereplacement: xxxxxx# 选择要监控pod所在的namespacenamespaceSelector:matchNames:- fluentd-demo# 填写要监控pod的Label值,以定位目标podselector:matchLabels:app: fluentd-demo
注意:
ServiceMonitor 采集(Logging Operator 使用)
Logging Operator 部署 Fluent Bit 场景中,指标导出是使用 ServiceMonitor 的方式,需要使用 ServiceMonitor 进行指标采集:
1. 登录 腾讯云可观测平台 > Prometheus 控制台,单击新建的实例 ID/名称。
2. 在数据采集页面,选择集成容器服务,单击集群右侧的数据采集配置,如下图所示:
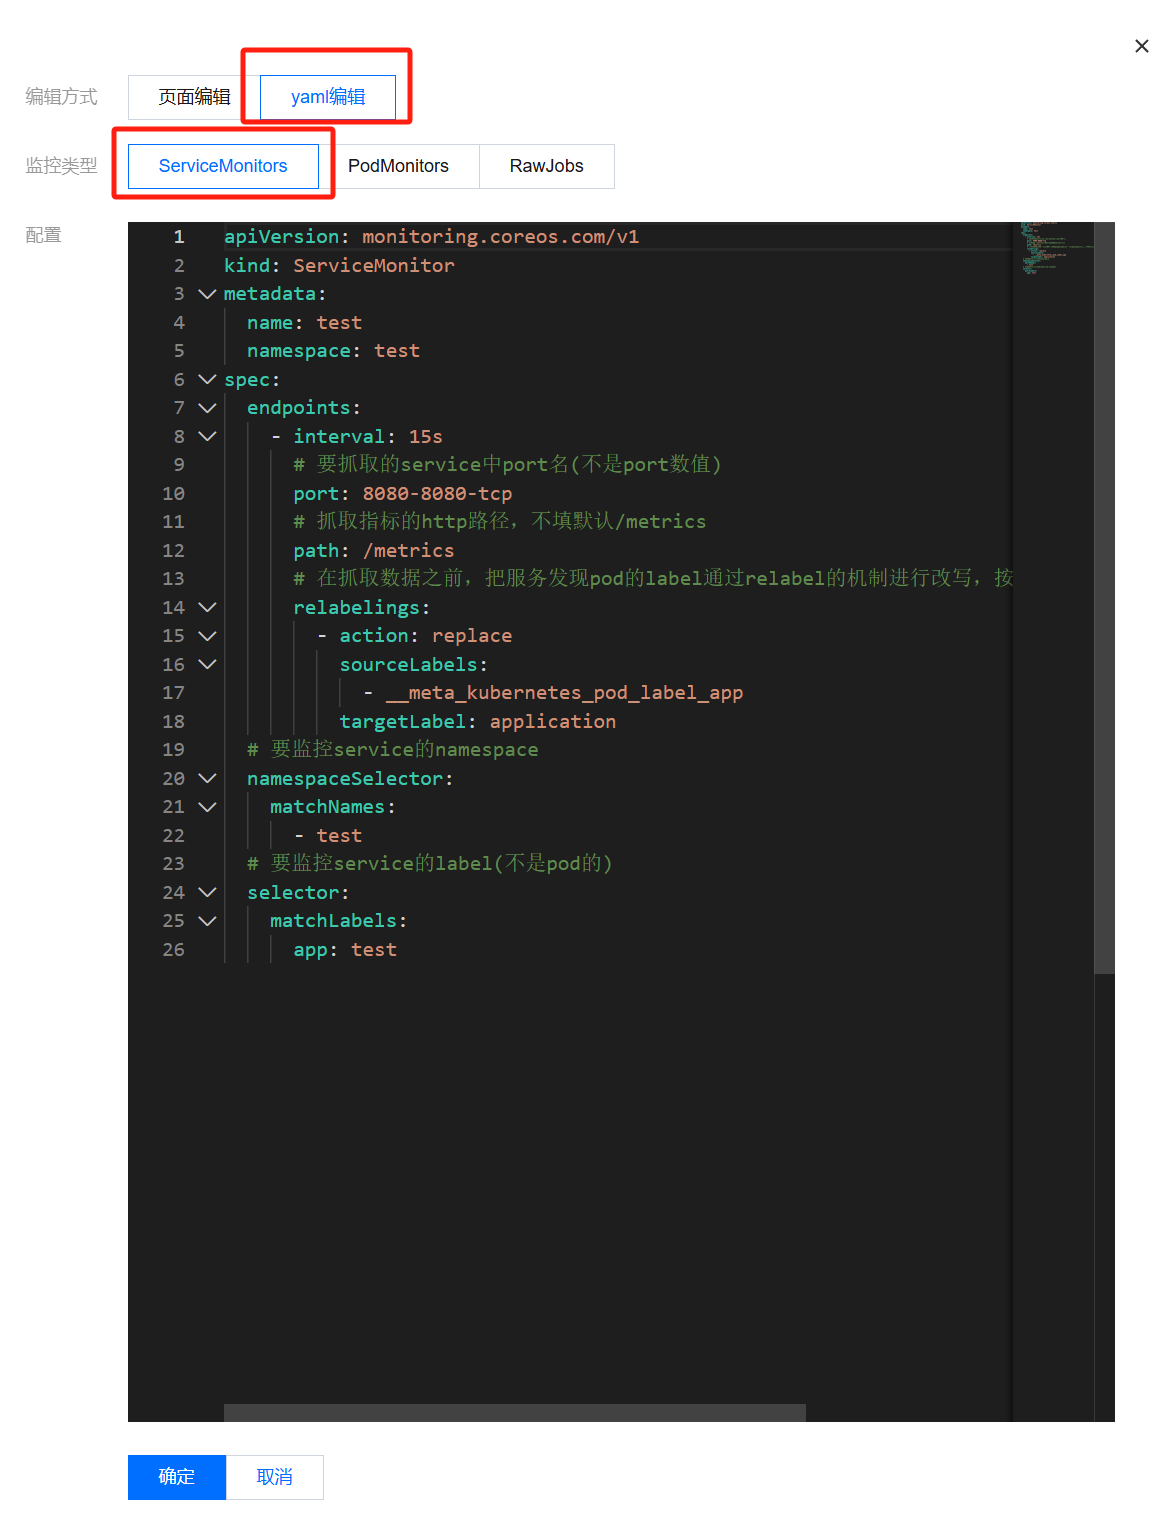
3. 进入数据采集配置页面后,单击新建自定义监控,在弹出的页面中选择 yaml 编辑,监控类型选择 ServiceMonitors,如下图所示:
4. 通过此方式添加
Service Monitor,目前支持基于 Labels 发现对应的目标实例地址,因此可以对一些服务添加特定的 K8S Labels,可以使 Labels 下的服务都会被 Prometheus 服务自动识别出来,不需要再为每个服务添加采集任务,以上面的例子配置信息如下:说明:
port 的取值为 service yaml 配置文件里的 spec/ports/name 对应的值。apiVersion: monitoring.coreos.com/v1kind: ServiceMonitormetadata:name: fluent-bit-demo # 填写一个唯一名称namespace: cm-prometheus # 根据业务调整命名空间spec:endpoints:- interval: 30s# 填写service yaml中Prometheus Exporter对应的Port的Nameport: metrics# 填写Prometheus Exporter对应的Path的值,不填默认/metricspath: /metricsrelabelings:# ** 必须要有一个 label 为 application,这里假设 k8s 有一个 label 为 app,# 我们通过 relabel 的 replace 动作把它替换成了 application- action: replacesourceLabels: [__meta_kubernetes_pod_label_app]targetLabel: application# 选择要监控service所在的namespacenamespaceSelector:matchNames:- fluent-bit-demo# 填写要监控service的Label值,以定位目标serviceselector:matchLabels:app: fluent-bit-app-demo
注意:
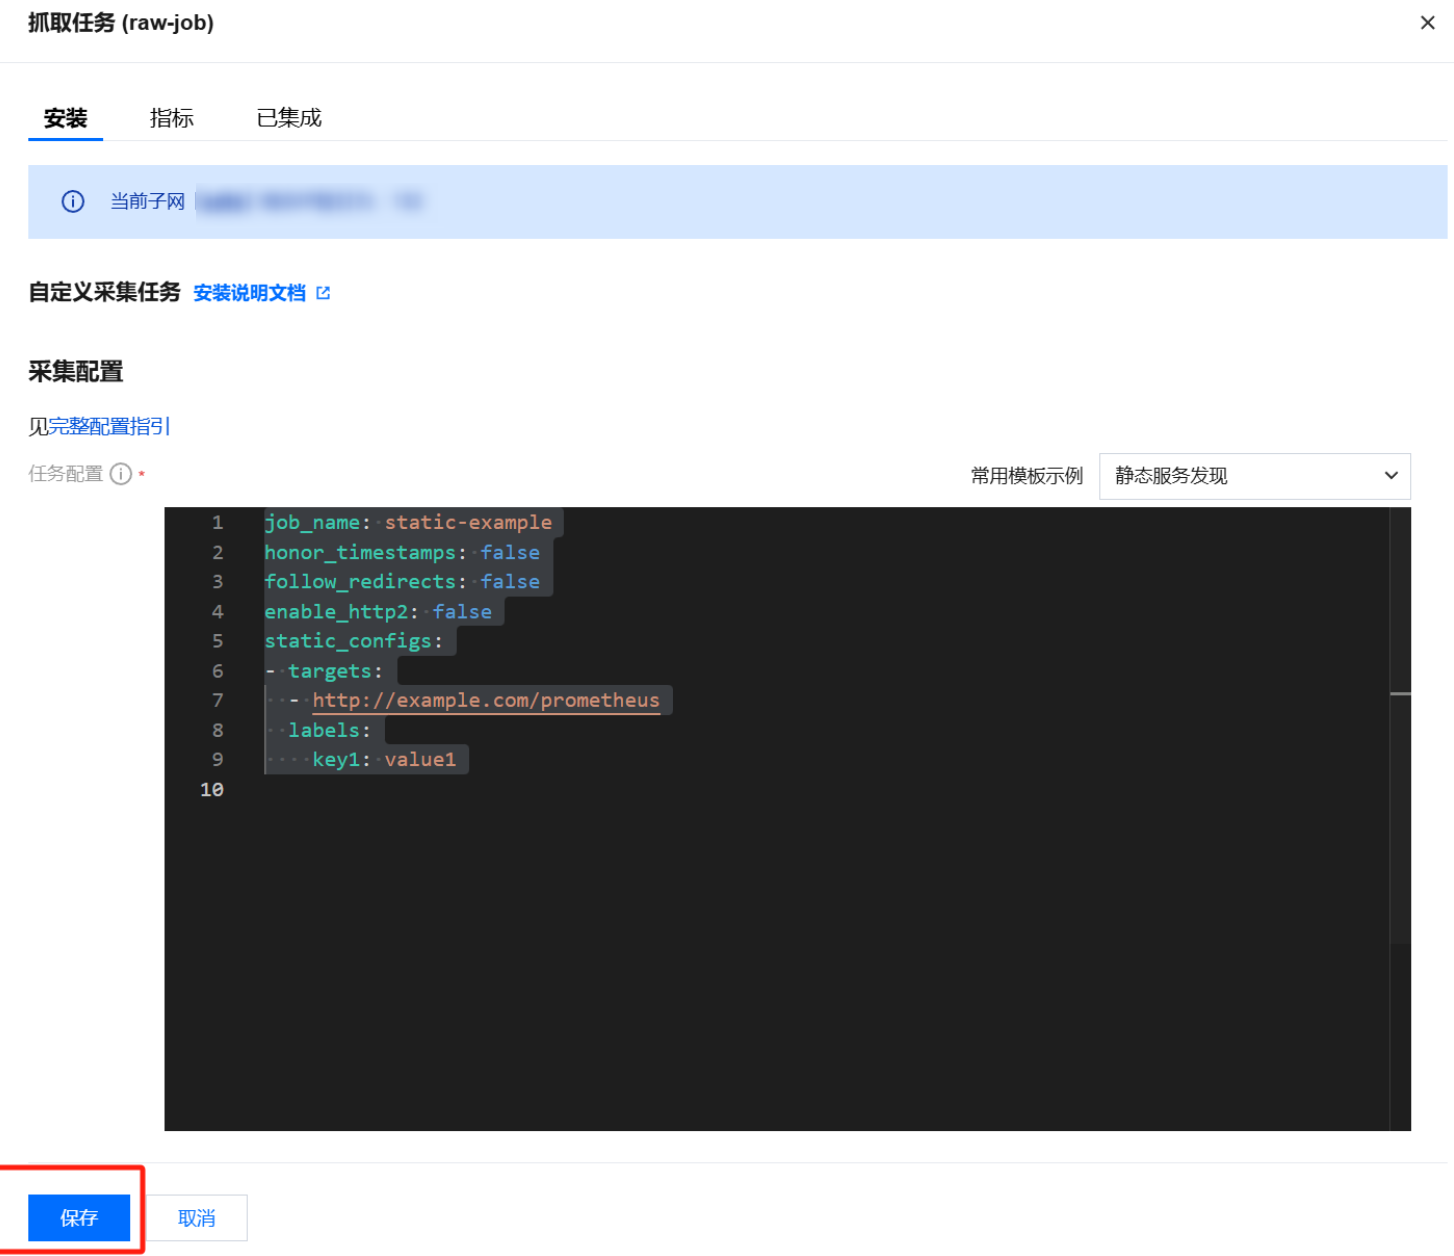
Rawjob 采集
Rawjob 采集需要配置 Fluentd 服务 pod ip,仅能在组件稳定为固定的 pod 时使用,动态扩缩容的情况下需要使用 Podmonitor 或者 Servicemonitor 来保证动态的服务发现。Rawjob 采集配置方式:
1. 登录 Prometheus 监控服务控制台。
2. 在实例列表中,选择对应的 Prometheus 实例。
3. 进入实例详情页,选择数据采集 > 集成中心。
4. 在集成中心找到并单击抓取任务,即会弹出一个安装窗口,在安装页面填写指标采集名称和地址等信息,并单击保存即可。
查看监控
1. 在 Prometheus 实例 列表,找到对应的 Prometheus 实例,单击实例ID 右侧
2. 选择数据采集 > 集成中心,在集成中心页面找到并单击 Fluentd 监控,选择 Dashboard > Dashboard 操作 > Dashboard 安装/升级,单击安装/升级安装对应的 Grafana Dashboard。
3. 进入 Grafana,单击


