HarryData 专业的数据可视化组件库

HarryData 专业的数据可视化组件库

Harry技术
发布于 2025-11-14 12:51:11
发布于 2025-11-14 12:51:11
Harry 技术出品 - 专业的数据可视化组件库
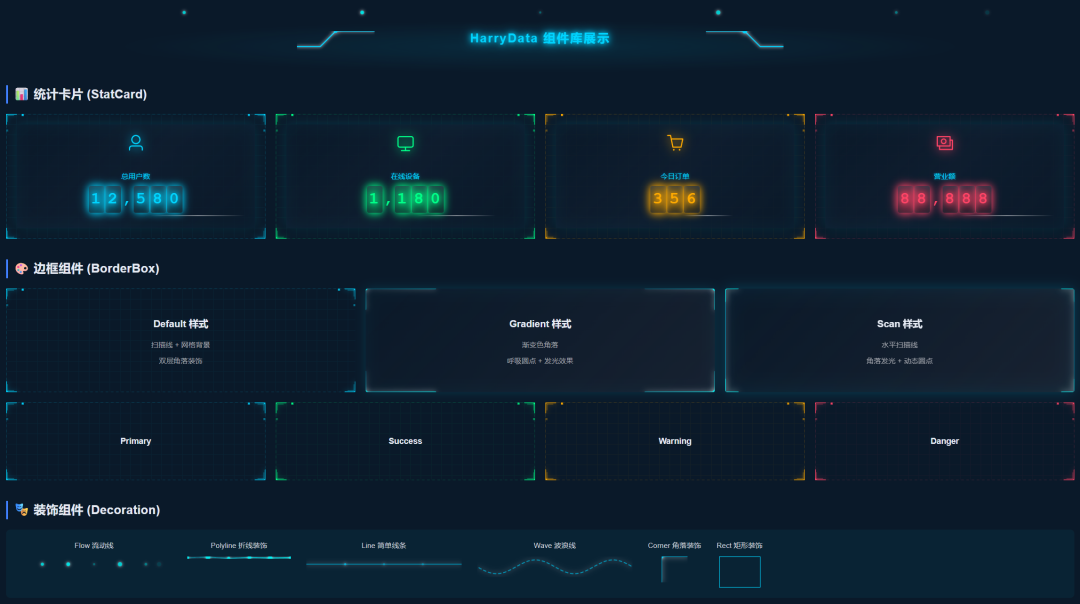
image-20251103115647179

image-20251103115712227
📖 简介
HarryData 是一套专为数据可视化大屏设计的 Vue3 组件库,提供了丰富的边框、装饰、数据展示和图表组件。
✨ 特性
🎨 精美设计 - 科技感十足的视觉效果
🌓 主题适配 - 完美支持明暗主题切换
📱 响应式 - 自适应各种屏幕尺寸
🚀 高性能 - 优化的动画和渲染
💪 TypeScript - 完整的类型支持
🎯 易用性 - 简洁的 API 设计
🚀 快速开始
安装
组件已内置在项目中,无需额外安装。
项目简介:基于 JDK 17、Spring Boot 3、Spring Security 6、JWT、Redis、Mybatis-Plus、Knife4j等构建后端,基于Vue 3、Element-Plus 、TypeScript等构建前端的分离单体权限管理系统。项目地址:
# 后端
https://gitee.com/harry-tech/harry.git
# 前端
https://gitee.com/harry-tech/harry-vue.git
导入使用
<template>
  <border-box type="gradient">
    <h1>欢迎使用 HarryData</h1>
  </border-box>
</template>

<script setup lang="ts">
import { BorderBox } from '@/components/HarryData'
</script>
按需导入
// 导入单个组件
import { BorderBox, Decoration, StatCard } from '@/components/HarryData'

// 导入多个组件
import {
  BorderBox,
  Decoration,
  DigitalFlop,
  WaterPolo,
  StatCard
} from '@/components/HarryData'
🗂️ 组件分类
1. 边框组件 (Border)
- BorderBox - 多样式边框容器
2. 装饰组件 (Decoration)
- Decoration - 多样式装饰线
3. 数据展示组件 (Display)
- DigitalFlop - 数字翻牌器
- StatCard - 统计卡片
- TitleBox - 标题组件
- ProgressBar - 进度条
- ScrollBoard - 滚动表格
4. 图表组件 (Charts)
- WaterPolo - 水球图
- ActiveRingChart - 活跃环形图
- FlylineChart - 飞线图
- CapsuleChart - 胶囊图
- ConicalChart - 锥形图
🎨 边框组件
BorderBox
多样式科技感边框容器,支持三种样式。
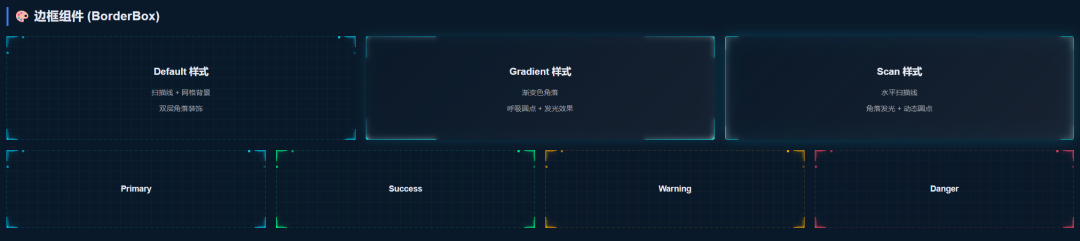
image-20251103114839448
image-20251103114839448
Props
参数 | 说明 | 类型 | 可选值 | 默认值 |
|---|---|---|---|---|
type | 边框样式 | string | default / gradient / scan | default |
variant | 颜色变体 | string | primary / success / warning / danger | primary |
width | 自定义宽度 | number/string | - | 100% |
height | 自定义高度 | number/string | - | 100% |
cornerSize | 角落装饰大小 | number | - | 20 |
showBorder | 是否显示边框 | boolean | - | true |
reverse | 是否翻转 | boolean | - | false |
color | 自定义颜色 | string[] | - | - |
使用示例
<template>
  <!-- 默认样式 -->
  <border-box variant="primary">
    <div>默认边框</div>
  </border-box>

  <!-- 渐变边框 -->
  <border-box type="gradient">
    <div>渐变边框</div>
  </border-box>

  <!-- 扫描线边框 -->
  <border-box type="scan" :corner-size="25">
    <div>扫描线边框</div>
  </border-box>

  <!-- 自定义颜色 -->
  <border-box type="gradient" :color="['#ff6b6b', '#4ecdc4']">
    <div>自定义颜色</div>
  </border-box>
</template>
样式说明
Default 样式:
- ✨ 扫描线动画
- 🎯 背景网格
- 💫 双层角落装饰
- 🔴 呼吸圆点
- 📏 虚线边框流动
Gradient 样式:
- 🎨 渐变色角落
- 🔴 呼吸圆点
- 💫 发光效果
- 🔄 支持翻转
Scan 样式:
- 📏 水平扫描线
- 🎯 渐变边框
- 💫 角落发光
- 🔴 动态圆点
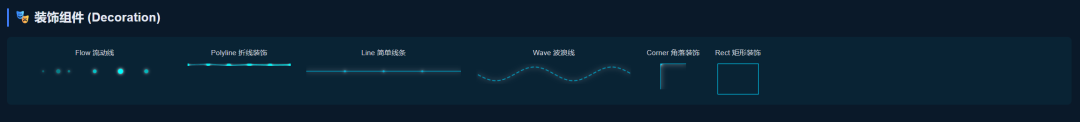
🎭 装饰组件
Decoration
多样式装饰线组件,用于页面点缀。
fdefa77f-5555-4c6a-a992-78c9283149ab
fdefa77f-5555-4c6a-a992-78c9283149ab
Props
参数 | 说明 | 类型 | 可选值 | 默认值 |
|---|---|---|---|---|
type | 装饰类型 | string | flow / polyline / line / corner / wave / rect | line |
width | 宽度 | number/string | - | 100% |
height | 高度 | number/string | - | 30 |
color | 颜色数组 | string[] | - | 自动适配主题 |
使用示例
<template>
  <!-- 流动线装饰 -->
  <decoration type="flow" :height="30" style="width:100%;" />

  <!-- 折线装饰 -->
  <decoration type="polyline" :width="200" :height="5" />

  <!-- 简单线条 -->
  <decoration type="line" :width="300" :height="2" />

  <!-- 角落装饰 -->
  <decoration type="corner" :width="50" :height="50" />

  <!-- 波浪线 -->
  <decoration type="wave" :width="400" :height="40" />

  <!-- 自定义颜色 -->
  <decoration
    type="flow"
    :height="30"
    :color="['#00d4ff', '#00ffff']"
  />
</template>
样式说明
类型 | 特效 | 适用场景 |
|---|---|---|
flow | 💫 流动光点 + 🔴 呼吸点 + 🎨 渐变线 | 页面顶部/底部装饰 |
polyline | 🔸 折线效果 + 💫 流动效果 + 🔴 圆点 | 标题旁装饰 |
line | 简单线条 + 装饰点 | 分隔线 |
corner | 角落图形 | 容器角落 |
wave | 波浪动画 | 动态装饰 |
rect | 矩形边框 | 简约装饰 |
📊 数据展示组件
DigitalFlop
数字翻牌器,带滚动动画的数字显示。

image-20251103115042619
image-20251103115042619
Props
参数 | 说明 | 类型 | 默认值 |
|---|---|---|---|
value | 数值 | number | 0 |
duration | 动画时长(ms) | number | 1500 |
decimals | 小数位数 | number | 0 |
separator | 千位分隔符 | string | , |
prefix | 前缀 | string | - |
suffix | 后缀 | string | - |
color | 颜色 | string | - |
使用示例
<template>
  <!-- 基础用法 -->
  <digital-flop :value="12345" />

  <!-- 带前缀后缀 -->
  <digital-flop
    :value="9999"
    prefix="¥"
    suffix="元"
  />

  <!-- 小数和自定义颜色 -->
  <digital-flop
    :value="88.88"
    :decimals="2"
    color="#00d4ff"
  />

  <!-- 自定义动画时长 -->
  <digital-flop
    :value="count"
    :duration="2000"
  />
</template>
StatCard
统计卡片,集成边框、图标、标题和数字翻牌器。
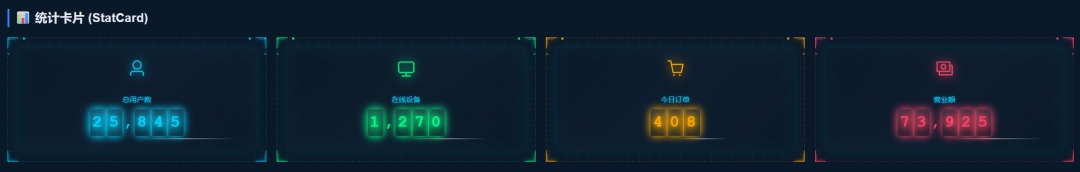
image-20251103114524654
image-20251103114524654
Props
参数 | 说明 | 类型 | 默认值 |
|---|---|---|---|
title | 标题 | string | - |
value | 数值 | number | 0 |
icon | 图标组件 | Component | - |
variant | 颜色变体 | string | primary |
prefix | 数值前缀 | string | - |
suffix | 数值后缀 | string | - |
使用示例
<template>
  <stat-card
    title="总用户数"
    :value="12580"
    variant="primary"
  >
    <template #icon>
      <el-icon><User /></el-icon>
    </template>
  </stat-card>

  <stat-card
    title="今日销售额"
    :value="88888"
    prefix="¥"
    variant="success"
  >
    <template #icon>
      <el-icon><Money /></el-icon>
    </template>
  </stat-card>
</template>

<script setup lang="ts">
import { User, Money } from '@element-plus/icons-vue'
import { StatCard } from '@/components/HarryData'
</script>
TitleBox
标题组件,带装饰线的标题框。
Props
参数 | 说明 | 类型 | 默认值 |
|---|---|---|---|
height | 高度 | number | 40 |
decorationWidth | 装饰线宽度 | number | 100 |
使用示例
<template>
  <title-box :height="50" :decoration-width="120">
    数据可视化大屏
  </title-box>
</template>
ProgressBar
进度条组件,带动画效果。
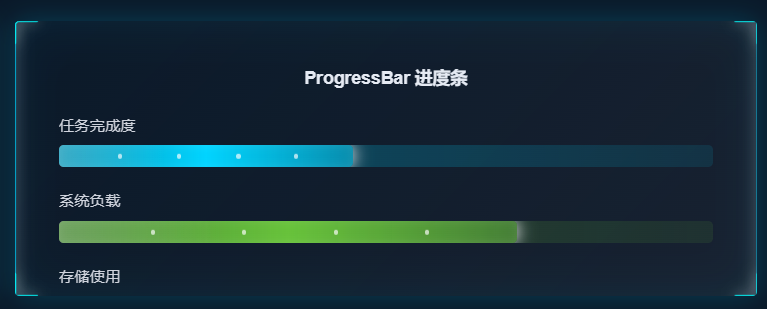
image-20251103115353408
image-20251103115353408
Props
参数 | 说明 | 类型 | 默认值 |
|---|---|---|---|
value | 进度值(0-100) | number | 0 |
color | 颜色 | string | #409eff |
height | 高度 | number | 20 |
showText | 显示文字 | boolean | true |
使用示例
<template>
  <progress-bar :value="75" />

  <progress-bar
    :value="60"
    color="#67c23a"
    :height="24"
  />
</template>
ScrollBoard
滚动表格,自动滚动的数据表格。
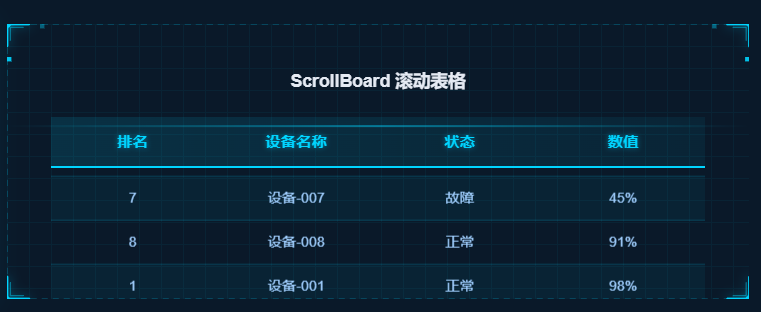
image-20251103115404309
image-20251103115404309
Props
参数 | 说明 | 类型 | 默认值 |
|---|---|---|---|
data | 表格数据 | array | [] |
header | 表头 | array | [] |
rowNum | 显示行数 | number | 5 |
headerBGC | 表头背景色 | string | - |
oddRowBGC | 奇数行背景色 | string | - |
evenRowBGC | 偶数行背景色 | string | - |
使用示例
<template>
  <scroll-board
    :data="tableData"
    :header="tableHeader"
    :row-num="5"
  />
</template>

<script setup lang="ts">
const tableHeader = ['排名', '姓名', '分数']
const tableData = [
  ['1', '张三', '95'],
  ['2', '李四', '92'],
  ['3', '王五', '88'],
  // ...
]
</script>
TitleBox
标题组件,带装饰线的标题框。
Props
参数 | 说明 | 类型 | 默认值 |
|---|---|---|---|
height | 高度 | number | 40 |
decorationWidth | 装饰线宽度 | number | 100 |
使用示例
<template>
  <title-box :height="50" :decoration-width="120">
    数据可视化大屏
  </title-box>
</template>
特性
- 🎨 自动主题适配
- 💫 装饰线动画
- 📝 居中标题显示
- 🌓 明暗主题切换
ProgressBar
进度条组件,带动画效果。
Props
参数 | 说明 | 类型 | 默认值 |
|---|---|---|---|
value | 进度值(0-100) | number | 0 |
color | 颜色 | string | #409eff |
height | 高度 | number | 20 |
showText | 显示文字 | boolean | true |
使用示例
<template>
  <progress-bar :value="75" />

  <progress-bar
    :value="60"
    color="#67c23a"
    :height="24"
  />
</template>
特性
- 📊 平滑动画过渡
- 🎨 自定义颜色
- 💫 发光效果
- 🌓 主题自适应
📈 图表组件
WaterPolo
水球图,显示百分比数据。

image-20251103115459603
image-20251103115459603
Props
参数 | 说明 | 类型 | 默认值 |
|---|---|---|---|
value | 百分比(0-100) | number | 0 |
size | 尺寸 | number | 100 |
color | 颜色 | string | #409eff |
使用示例
<template>
  <water-polo :value="75" :size="150" color="#00d4ff" />
</template>
ActiveRingChart
活跃环形图,显示活跃度数据。

image-20251103115520113
image-20251103115520113
Props
参数 | 说明 | 类型 | 默认值 |
|---|---|---|---|
data | 数据 | object | - |
radius | 半径 | number | 100 |
使用示例
<template>
  <active-ring-chart
    :data="ringData"
    :radius="120"
  />
</template>

<script setup lang="ts">
const ringData = {
  active: 75,
  total: 100
}
</script>
FlylineChart
飞线图,展示数据流向。
Props
参数 | 说明 | 类型 | 默认值 |
|---|---|---|---|
data | 飞线数据 | array | [] |
width | 宽度 | number | 600 |
height | 高度 | number | 400 |
使用示例
<template>
  <flyline-chart
    :data="flylineData"
    :width="800"
    :height="500"
  />
</template>

<script setup lang="ts">
const flylineData = [
  { from: [120, 30], to: [130, 40] },
  { from: [110, 50], to: [140, 60] }
]
</script>
CapsuleChart
胶囊图,横向对比数据。
Props
参数 | 说明 | 类型 | 默认值 |
|---|---|---|---|
data | 数据 | array | [] |
height | 高度 | number | 300 |
使用示例
<template>
  <capsule-chart :data="capsuleData" :height="350" />
</template>

<script setup lang="ts">
const capsuleData = [
  { name: '产品A', value: 85 },
  { name: '产品B', value: 70 },
  { name: '产品C', value: 60 }
]
</script>
ConicalChart
锥形图,展示漏斗数据。
Props
参数 | 说明 | 类型 | 默认值 |
|---|---|---|---|
data | 数据 | array | [] |
height | 高度 | number | 300 |
使用示例
<template>
  <conical-chart :data="conicalData" :height="400" />
</template>

<script setup lang="ts">
const conicalData = [
  { name: '访问', value: 1000 },
  { name: '咨询', value: 500 },
  { name: '成交', value: 100 }
]
</script>
🌓 主题适配
所有组件都完美支持明暗主题切换。
自动适配
组件会自动检测当前主题并调整样式:
<template>
  <!-- 无需额外配置,自动适配主题 -->
  <border-box type="gradient">
    <stat-card title="用户数" :value="12345" />
  </border-box>
</template>
主题特性
明亮主题:
- 清新的蓝色调
- 柔和的阴影
- 高对比度文字
暗黑主题:
- 科技感的青色调
- 发光滤镜效果
- 霓虹灯风格
💡 最佳实践
1. 组件组合
合理组合组件以获得最佳效果:
<template>
  <!-- 标题区 -->
  <decoration type="flow" :height="30" style="width:100%;" />

  <!-- 内容区 -->
  <border-box type="gradient">
    <title-box>数据统计</title-box>

    <el-row :gutter="20">
      <el-col :span="6">
        <stat-card title="总用户" :value="12580" variant="primary">
          <template #icon><el-icon><User /></el-icon></template>
        </stat-card>
      </el-col>
      <!-- 更多卡片... -->
    </el-row>
  </border-box>
</template>
2. 响应式布局
使用 Element Plus 栅格系统:
<template>
  <el-row :gutter="20">
    <el-col :xs="24" :sm="12" :md="8" :lg="6">
      <stat-card title="数据1" :value="100" />
    </el-col>
    <el-col :xs="24" :sm="12" :md="8" :lg="6">
      <stat-card title="数据2" :value="200" />
    </el-col>
  </el-row>
</template>
3. 性能优化
对于大量数据,使用虚拟滚动:
<template>
  <scroll-board
    :data="largeData"
    :row-num="10"
    :header="header"
  />
</template>
4. 颜色搭配
推荐的颜色组合:
// 科技蓝
const techBlue = ['#00d4ff', '#00ffff']

// 渐变紫
const gradientPurple = ['#667eea', '#764ba2']

// 霓虹绿
const neonGreen = ['#00ff88', '#00ffcc']

// 火焰红
const fireRed = ['#ff6b6b', '#ff8787']
5. 动画性能
避免同时运行过多动画:
<template>
  <!-- ✅ 好的做法 -->
  <border-box type="gradient">
    <digital-flop :value="count" />
  </border-box>

  <!-- ❌ 避免过多嵌套动画 -->
  <border-box type="gradient">
    <border-box type="scan">
      <digital-flop :value="count" />
    </border-box>
  </border-box>
</template>
📦 完整示例
数据大屏示例
<template>
  <div class="data-screen">
    <!-- 顶部装饰 -->
    <decoration type="flow" :height="30" style="width:100%;" />

    <!-- 标题 -->
    <title-box :height="60" :decoration-width="150">
      智能柜数据监控大屏
    </title-box>

    <!-- 统计卡片区 -->
    <el-row :gutter="20" class="stats-row">
      <el-col :span="6">
        <stat-card
          title="总设备数"
          :value="deviceCount"
          variant="primary"
        >
          <template #icon>
            <el-icon><Monitor /></el-icon>
          </template>
        </stat-card>
      </el-col>

      <el-col :span="6">
        <stat-card
          title="在线设备"
          :value="onlineCount"
          variant="success"
        >
          <template #icon>
            <el-icon><Connection /></el-icon>
          </template>
        </stat-card>
      </el-col>

      <el-col :span="6">
        <stat-card
          title="今日订单"
          :value="orderCount"
          variant="warning"
        >
          <template #icon>
            <el-icon><ShoppingCart /></el-icon>
          </template>
        </stat-card>
      </el-col>

      <el-col :span="6">
        <stat-card
          title="营业额"
          :value="revenue"
          prefix="¥"
          variant="danger"
        >
          <template #icon>
            <el-icon><Money /></el-icon>
          </template>
        </stat-card>
      </el-col>
    </el-row>

    <!-- 图表区 -->
    <el-row :gutter="20">
      <el-col :span="12">
        <border-box type="scan">
          <div class="chart-container">
            <h3>设备分布</h3>
            <decoration type="polyline" :width="200" :height="5" />
            <water-polo :value="75" :size="150" />
          </div>
        </border-box>
      </el-col>

      <el-col :span="12">
        <border-box type="gradient">
          <div class="chart-container">
            <h3>实时数据</h3>
            <scroll-board
              :data="realtimeData"
              :header="tableHeader"
              :row-num="8"
            />
          </div>
        </border-box>
      </el-col>
    </el-row>
  </div>
</template>

<script setup lang="ts">
import { ref } from 'vue'
import {
  BorderBox,
  Decoration,
  StatCard,
  TitleBox,
  WaterPolo,
  ScrollBoard
} from '@/components/HarryData'
import {
  Monitor,
  Connection,
  ShoppingCart,
  Money
} from '@element-plus/icons-vue'

const deviceCount = ref(1258)
const onlineCount = ref(1180)
const orderCount = ref(356)
const revenue = ref(88888)

const tableHeader = ['时间', '设备', '状态']
const realtimeData = ref([
  ['10:30', '设备001', '正常'],
  ['10:25', '设备002', '正常'],
  // ...
])
</script>

<style lang="scss" scoped>
.data-screen {
  padding: 20px;
  background: #0a1929;
  min-height: 100vh;

  .stats-row {
    margin: 30px 0;
  }

  .chart-container {
    padding: 20px;

    h3 {
      color: #00d4ff;
      margin-bottom: 15px;
      text-align: center;
    }
  }
}
</style>
本文参与 腾讯云自媒体同步曝光计划,分享自微信公众号。
原始发表:2025-11-03,如有侵权请联系 cloudcommunity@tencent.com 删除
评论
登录后参与评论
推荐阅读
目录
腾讯云开发者

Copyright © 2013 - 2026 Tencent Cloud. All Rights Reserved. 腾讯云 版权所有
深圳市腾讯计算机系统有限公司 ICP备案/许可证号:粤B2-20090059 ![]() 粤公网安备44030502008569号
粤公网安备44030502008569号
腾讯云计算(北京)有限责任公司 京ICP证150476号 | 京ICP备11018762号