使用算法解决热播剧《长安的荔枝》中荔枝的运送路径问题
原创

使用算法解决热播剧《长安的荔枝》中荔枝的运送路径问题
一、介绍
在目前的热播剧《长安的荔枝》中,如何将岭南的荔枝快速地运送到长安,这是一个艰难无比的任务。
剧中荔枝使李善德想出了分枝连瓮法,搭配驿站接力的方式将荔枝运送到长安的,将带着荔枝的树杈砍下,浸泡盐水后密封进双层陶罐,以此延长荔枝的保鲜期,成功将保鲜期延长至11天。
但在如今,冷链运输已经时分发达,大大延长了荔枝的保鲜期。
但同样的,如今路网的发达,也是古代不可想象的,我们该如何选择运输路线,才能保证岭南的荔枝快速的运往长安(今西安)呢?
路网如下,我们应该如何计算出最优路线?
 {
     '深圳': { '广州': 1.5, '东莞': 1.0 },
     '广州': { '深圳': 1.5, '韶关': 2.5, '长沙': 5.5 },
     '东莞': { '深圳': 1.0, '惠州': 1.2 },
     '惠州': { '东莞': 1.2, '武汉': 8.0 },
     '韶关': { '广州': 2.5, '长沙': 4.0 },
     '长沙': { '韶关': 4.0, '武汉': 3.0, '郑州': 8.0 },
     '武汉': { '惠州': 8.0, '长沙': 3.0, '郑州': 4.5, '西安': 10.0 },
     '郑州': { '长沙': 8.0, '武汉': 4.5, '洛阳': 2.0 },
     '洛阳': { '郑州': 2.0, '西安': 5.0 },
     '西安': { '武汉': 10.0, '洛阳': 5.0 }
 }
不多说,直接展示最终的效果

result
二、广度优先
在解决图路径的问题上,广度优先算法(Breadth-First Search,简称BFS)是一个很好的切入点,他比较简单,下面我们先看看其思路。
- 我们先遍历起点(也就是深圳)能到达的城市,分别记录下它的时间
- 将上面记录下来,相邻的城市,把其当做起点,又记录下它能到达的城市
- 重复上面的步骤,直到到达最后的城市西安
- 将所有的路线结果,进行对比就能算出耗时最短的路线
直接来看代码
// 城市图数据,括号中的数字代表运输时间
const cityGraph = {
'深圳': { '广州': 1.5, '东莞': 1.0 },
'广州': { '深圳': 1.5, '韶关': 2.5, '长沙': 5.5 },
'东莞': { '深圳': 1.0, '惠州': 1.2 },
'惠州': { '东莞': 1.2, '武汉': 8.0 },
'韶关': { '广州': 2.5, '长沙': 4.0 },
'长沙': { '韶关': 4.0, '武汉': 3.0, '郑州': 8.0 },
'武汉': { '惠州': 8.0, '长沙': 3.0, '郑州': 4.5, '西安': 10.0 },
'郑州': { '长沙': 8.0, '武汉': 4.5, '洛阳': 2.0 },
'洛阳': { '郑州': 2.0, '西安': 5.0 },
'西安': { '武汉': 10.0, '洛阳': 5.0 }
};
// 使用BFS寻找最短路径
function bfsShortestPath(graph, start, end) {
// 初始化数据结构,记录当前城市,以及路径,花费时间
const queue = [{ city: start, path: [start], time: 0 }];
// 记录结果
const result = [];
while (queue.length > 0) {
// 从队列头部取出当前节点
const { city, path, time } = queue.shift();
// 记录已经访问过的城市
const visited = new Set(path);
// 如果到达终点,添加至结果
if (city === end) {
result.push({ path, totalTime: time });
continue;
}
// 找到当前城市相邻的城市
const neighbors = graph[city];
for (const neighbor in neighbors) {
if (!visited.has(neighbor)) {
visited.add(neighbor);
const edgeTime = neighbors[neighbor];
queue.push({
city: neighbor,
path: [...path, neighbor],
time: time + edgeTime
});
}
}
}
// 如果有结果,则对比最优,返回结果
if (result.length > 0) {
return result.sort((a, b) => a.totalTime - b.totalTime)[0];
}
// 如果未找到路径,返回null
return null;
}
// 格式化路径输出
function formatPath(path, totalTime) {
let output = `最优路径:${path.join(' → ')}\n`;
output += `总运输时间:${totalTime.toFixed(1)} 小时\n`;
output += `路径长度:${path.length} 个城市节点\n`;
// 添加路径细节
for (let i = 0; i < path.length - 1; i++) {
const from = path[i];
const to = path[i + 1];
const time = cityGraph[from][to];
output += `${from} → ${to}: ${time} 小时\n`;
}
return output;
}
// 计算并显示路径
function calculatePath(start='深圳', end='西安') {
const results = bfsShortestPath(cityGraph, start, end);
if (results) {
const formattedResult = formatPath(results.path, results.totalTime);
console.log(formattedResult);
} else {
console.log(`未找到从${start}到${end}的路径!`);
}
}
calculatePath();运行查看一下结果,如下
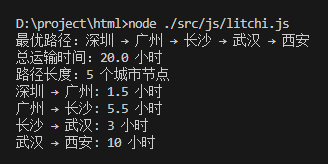
image-20250623142112242
但是这种方式有一个弊端,就是这种方式主要用于寻找无权图中的最短路径,也就是最少节点数 上面我虽然考虑到了多路径的情况,可能存在耗时更短的可能,遍历了所有路径的可能,并找到了最短耗时的路径。 但这本质上还是节点数的广度优先,本来就应该在首次找到一条路径就应该结束掉的。 并且还需要考虑,时间与路费之间的权重计算,这就是广度优先的局限所在。 那么,是否还有其他的算法,能够解决广度优先算法的缺点,并且加入权重计算因子,让其整个运算更加的灵活 有的兄弟有的..那就是
Dijkstra算法
三、Dijkstra算法
该算法由迪杰斯特拉算法(Dijkstra)荷兰计算机科学家狄克斯特拉于1959年提出的,使用了广度优先搜索解决赋权有向图或者无向图的单源最短路径问题,算法最终得到一个最短路径树。
算法思路,采用了一种贪心的策略,首先声明了一个对象(主要用来保存起点到每个节点的最短距离),再声明另一个对象(用来保存每个节点的上个来源节点)
对于初始化,我们上面运送荔枝,需要考虑到节点与节点之间的运输时间。
则可以将第一个对象这样定义
// 这个对象记录着,起点(深圳)去每个城市节点需要的耗时
// 由于深圳是起点,直接赋值为0
let time = {
'深圳': 0,
'广州': Infinity,
'东莞': Infinity,
'惠州': Infinity,
'韶关': Infinity,
'长沙': Infinity,
'武汉': Infinity,
'郑州': Infinity,
'洛阳': Infinity,
'西安': Infinity
}
// 而另外一个对象,我们还没有进行计算最短耗时,所以目前还是处于空对象
let previous = {}
// 剩下的和广度优先算法很像,就是将这两个相邻的节点当做起点,继续向后去寻找
// 需要注意的是,time对象记录的是,起点到当前节点,所需要的耗时
// 比如说深圳,可以到达广州、东莞,那么在进行一轮计算之后,这两个对象就会更新为
 let time = {
     '深圳': 0,
     '广州': 1.5,
     '东莞': 1,
     '惠州': Infinity,
     '韶关': Infinity,
     '长沙': Infinity,
     '武汉': Infinity,
     '郑州': Infinity,
     '洛阳': Infinity,
     '西安': Infinity
 }
 let previous = {
     '广州': '深圳',
     '东莞': '深圳'
 }
接下来,我们就需要去计算广州、东莞这两座城市,能到达的目标城市
和广度优先算法很像,就是将相邻的节点当做起点,继续向后去寻找
再次强调,time对象记录的是,起点到当前节点,所需要的耗时
而previous对象记录的是,每个被计算过时间的节点,它的上一个节点是什么
那么计算到最后,这两个对象就会变成下面这种情况
 let time = {
     '深圳': 0,
     '广州': 1.5,
     '东莞': 1,
     '惠州': 2.2,
     '韶关': 4,
     '长沙': 7,
     '武汉': 10,
     '郑州': 14.5,
     '洛阳': 16.5,
     '西安': 20
 }
 let previous = {
     '广州': '深圳',
     '东莞': '深圳',
     '惠州': '东莞',
     '韶关': '广州',
     '长沙': '广州',
     '武汉': '长沙',
     '郑州': '武汉',
     '西安': '武汉',
     '洛阳': '郑州'
}可以看到第一个对象time,已经将起点到西安所需要的耗时给计算出来了,总共是20个小时
但我们从起点出发到终点的一个路径,那这时候就该用到previous对象了
我们只需要从后往前,进行回溯,找到西安的上个城市(武汉),然后继续向前找,直到找到深圳,那么路径就出来了
废话不多说,我们直接开始代码的编写
// 城市图数据,括号中的数字代表运输时间
const cityGraph = {
'深圳': { '广州': 1.5, '东莞': 1.0 },
'广州': { '深圳': 1.5, '韶关': 2.5, '长沙': 5.5 },
'东莞': { '深圳': 1.0, '惠州': 1.2 },
'惠州': { '东莞': 1.2, '武汉': 8.0 },
'韶关': { '广州': 2.5, '长沙': 4.0 },
'长沙': { '韶关': 4.0, '武汉': 3.0, '郑州': 8.0 },
'武汉': { '惠州': 8.0, '长沙': 3.0, '郑州': 4.5, '西安': 10.0 },
'郑州': { '长沙': 8.0, '武汉': 4.5, '洛阳': 2.0 },
'洛阳': { '郑州': 2.0, '西安': 5.0 },
'西安': { '武汉': 10.0, '洛阳': 5.0 }
};
// 使用dijkstra寻找最短路径
function dijkstraShortestPath(graph, start, end) {
// 初始化数据,记录起点到当前节点的时间
const time = {};
// 初始化数据,记录每个被计算过时间的节点,它的上一个节点是什么
const previous = {};
// 初始化数据,节点列表
const nodes = [];
// 初始化起点到所有城市时间为Infinity
for (const city in graph) {
time[city] = Infinity;
}
// 起点到起点所需的时间为0
time[start] = 0;
// 起点加入节点列表
nodes.push(start);
while (nodes.length > 0) {
// 找到当前距离最小的节点
let minIndex = 0;
for (let i = 1; i < nodes.length; i++) {
if (time[nodes[i]] < time[nodes[minIndex]]) {
minIndex = i;
}
}
const currentCity = nodes[minIndex];
// 从数组中移除该节点
nodes.splice(minIndex, 1);
if (currentCity === end)
break;
// 遍历当前节点的所有相邻节点
for (const neighborCity in graph[currentCity]) {
// 起点到相邻节点需要的时间 = 起点到当前节点的时间 + 从当前节点到相邻节点的时间
const alt = time[currentCity] + graph[currentCity][neighborCity];
// 如果时间小于当前记录的时间
if (alt < time[neighborCity]) {
// 更新时间
time[neighborCity] = alt;
// 更新路径,从哪个节点来的
previous[neighborCity] = currentCity;
// 将相邻节点加入节点列表
if (!nodes.includes(neighborCity)) {
nodes.push(neighborCity);
}
}
}
}
// 上面的代码已经计算好了,现在我们需要回溯
const path = [];
let current = end;
while (current !== start) {
path.unshift(current);
current = previous[current];
if (!current) {
return null; // 不可达
}
}
path.unshift(start);
// 返回结果
return {
path,
totalTime: time[end]
};
}
// 格式化路径输出
function formatPath(path, totalTime) {
let output = `最优路径:${path.join(' → ')}\n`;
output += `总运输时间:${totalTime.toFixed(1)} 小时\n`;
output += `路径长度:${path.length} 个城市节点\n`;
// 添加路径细节
for (let i = 0; i < path.length - 1; i++) {
const from = path[i];
const to = path[i + 1];
const time = cityGraph[from][to];
output += `${from} → ${to}: ${time} 小时\n`;
}
return output;
}
// 计算并显示路径
function calculatePath(start='深圳', end='西安') {
const results = dijkstraShortestPath(cityGraph, start, end);
if (results) {
const formattedResult = formatPath(results.path, results.totalTime);
console.log(formattedResult);
} else {
console.log(`未找到从${start}到${end}的路径!`);
}
}
calculatePath();运行结果如下图
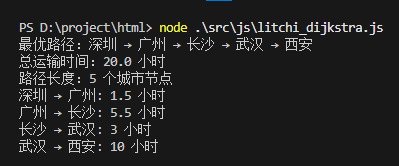
image-20250624184937698
四、添加权重
是不是还差了什么,我们还可以添加每条边的费用,让时间与费用进行PK选择,在此基础上添加权重因子,从而计算出最终路线
那么我们,就需要对这段json基础数据做出一点点的改动了,time代表所需要的耗时,cost代表所需要的权重
 {
     "深圳": {"广州": {"time": 1.5, "cost": 300}, "东莞": {"time": 1.0, "cost": 150}},
     "广州": {"深圳": {"time": 1.5, "cost": 300}, "韶关": {"time": 2.5, "cost": 400}, "长沙": {"time": 5.5, "cost": 600}},
     "东莞": {"深圳": {"time": 1.0, "cost": 150}, "惠州": {"time": 1.2, "cost": 200}},
     "惠州": {"东莞": {"time": 1.2, "cost": 200}, "武汉": {"time": 8.0, "cost": 1200}},
     "韶关": {"广州": {"time": 2.5, "cost": 400}, "长沙": {"time": 4.0, "cost": 550}},
     "长沙": {"韶关": {"time": 4.0, "cost": 550}, "武汉": {"time": 3.0, "cost": 450}, "郑州": {"time": 8.0, "cost": 900}},
     "武汉": {"惠州": {"time": 8.0, "cost": 1200}, "长沙": {"time": 3.0, "cost": 450}, "郑州": {"time": 4.5, "cost": 650}, "西安": {"time": 10.0, "cost": 1500}},
     "郑州": {"长沙": {"time": 8.0, "cost": 900}, "武汉": {"time": 4.5, "cost": 650}, "洛阳": {"time": 2.0, "cost": 300}},
     "洛阳": {"郑州": {"time": 2.0, "cost": 300}, "西安": {"time": 5.0, "cost": 700}},
     "西安": {"武汉": {"time": 10.0, "cost": 1500}, "洛阳": {"time": 5.0, "cost": 700}}
 }
那么,既然我们需要考虑两个维度,那就需要给予相对应的权重
 // 时间权重,费用权重
const timeWeight = 1.0, costWeight = 1.0;对于时间数值比较小,费用数值比较大的问题,采用归一化处理,也就是当前时间最大时间时间权重当前费用最大费用费用权重
如此一来,两个维度的数值大小将会被缩小计算。
代码修改,和前一章节一样,只是权重的计算比较那一块需要进行改动,基本算法都是一致的,直接来看代码
// 城市图数据,time: 时间,cost: 花费
const cityGraph = {
'深圳': {'广州': {time: 1.5, cost: 300}, '东莞': {time: 1.0, cost: 150}},
'广州': {'深圳': {time: 1.5, cost: 300}, '韶关': {time: 2.5, cost: 400}, '长沙': {time: 5.5, cost: 600}},
'东莞': {'深圳': {time: 1.0, cost: 150}, '惠州': {time: 1.2, cost: 200}},
'惠州': {'东莞': {time: 1.2, cost: 200}, '武汉': {time: 8.0, cost: 1200}},
'韶关': {'广州': {time: 2.5, cost: 400}, '长沙': {time: 4.0, cost: 550}},
'长沙': {'韶关': {time: 4.0, cost: 550}, '武汉': {time: 3.0, cost: 450}, '郑州': {time: 8.0, cost: 900}},
'武汉': {'惠州': {time: 8.0, cost: 1200}, '长沙': {time: 3.0, cost: 450}, '郑州': {time: 4.5, cost: 650}, '西安': {time: 10.0, cost: 1500}},
'郑州': {'长沙': {time: 8.0, cost: 900}, '武汉': {time: 4.5, cost: 650}, '洛阳': {time: 2.0, cost: 300}},
'洛阳': {'郑州': {time: 2.0, cost: 300}, '西安': {time: 5.0, cost: 700}},
'西安': {'武汉': {time: 10.0, cost: 1500}, '洛阳': {time: 5.0, cost: 700}}
};
// 获取全图最大时间和费用
function getMaxValues(graph) {
let maxTime = 0;
let maxCost = 0;
for (const city in graph) {
for (const neighbor in graph[city]) {
const edge = graph[city][neighbor];
maxTime = Math.max(maxTime, edge.time);
maxCost = Math.max(maxCost, edge.cost);
}
}
return { maxTime, maxCost };
}
// 使用dijkstra寻找最短路径
function dijkstraShortestPath(graph, start, end, timeWeight = 1.0, costWeight = 1.0) {
// 获取全图最大时间和费用用于归一化
const { maxTime, maxCost } = getMaxValues(graph);
// 初始化数据,记录起点到当前节点的权重值
const weights = {};
// 初始化数据,记录每个被计算过权重的节点,它的上一个节点是什么
const previous = {};
// 初始化数据,节点列表
const nodes = [];
// 初始化起点到所有城市权重为Infinity
for (const city in graph) {
weights[city] = {
time: Infinity,
cost: Infinity,
weights: Infinity
};
}
// 起点到起点所需的权重为0,同时记录时间与费用
weights[start] = {
time: 0,
cost: 0,
weights: 0
};
// 起点加入节点列表
nodes.push(start);
while (nodes.length > 0) {
// 找到当前权重最小的节点
let minIndex = 0;
for (let i = 1; i < nodes.length; i++) {
if (weights[nodes[i]].weights < weights[nodes[minIndex]].weights) {
minIndex = i;
}
}
const currentCity = nodes[minIndex];
// 从数组中移除该节点
nodes.splice(minIndex, 1);
if (currentCity === end)
break;
// 遍历当前节点的所有相邻节点
for (const neighborCity in graph[currentCity]) {
// 计算归一化后的时间和费用权重
const normalizedTime = graph[currentCity][neighborCity].time / maxTime;
const normalizedCost = graph[currentCity][neighborCity].cost / maxCost;
// 计算组合权重
let edgeWeight = (normalizedTime * timeWeight) + (normalizedCost * costWeight);
const alt = weights[currentCity].weights + edgeWeight;
const timeAlt = weights[currentCity].time + graph[currentCity][neighborCity].time;
const costAlt = weights[currentCity].cost + graph[currentCity][neighborCity].cost;
// 如果新权重小于当前记录的权重
if (alt < weights[neighborCity].weights) {
// 更新权重,费用,时间
weights[neighborCity].weights = alt;
weights[neighborCity].time = timeAlt;
weights[neighborCity].cost = costAlt;
// 更新路径,从哪个节点来的
previous[neighborCity] = currentCity;
// 将相邻节点加入节点列表
if (!nodes.includes(neighborCity)) {
nodes.push(neighborCity);
}
}
}
}
// 上面的代码会得到一个对象,包含路径和总时间,我们需要路径
const path = [];
let current = end;
while (current !== start) {
path.unshift(current);
current = previous[current];
if (!current) {
return null; // 不可达
}
}
path.unshift(start);
// 返回结果
return {
path,
allWeight: weights,
weights: weights[end]
};
}
// 格式化路径输出
function formatPath(path, totalWeight, allWeight, timeWeight = 1.0, costWeight = 1.0) {
let output = `最优路径:${path.join(' → ')}\n`;
output += `总组合权重:${totalWeight.weights.toFixed(4)} (时间权重: ${timeWeight}, 费用权重: ${costWeight})\n`;
output += `路径长度:${path.length} 个城市节点\n`;
// 添加路径细节
let totalTime = 0;
let totalCost = 0;
let totalWeights = 0;
for (let i = 0; i < path.length - 1; i++) {
const from = path[i];
const to = path[i + 1];
const currentWeight = allWeight[to];
output += `${from} → ${to}:\n`;
output += ` 时间: ${currentWeight.time - totalTime}小时\n`;
output += ` 费用: ${currentWeight.cost - totalCost}元\n`;
output += ` 权重: ${(currentWeight.weights - totalWeights).toFixed(4)}\n`;
totalTime = currentWeight.time;
totalCost = currentWeight.cost;
totalWeights = currentWeight.weights;
}
return output;
}
// 计算并显示路径
function calculatePath(start='深圳', end='西安', timeWeight=1.0, costWeight=1.0) {
const results = dijkstraShortestPath(cityGraph, start, end, timeWeight, costWeight);
if (results) {
const formattedResult = formatPath(results.path, results.weights, results.allWeight, timeWeight, costWeight);
console.log(formattedResult);
} else {
console.log(`未找到从${start}到${end}的路径!`);
}
}
// 示例调用
calculatePath('深圳', '西安', 1, 0.5);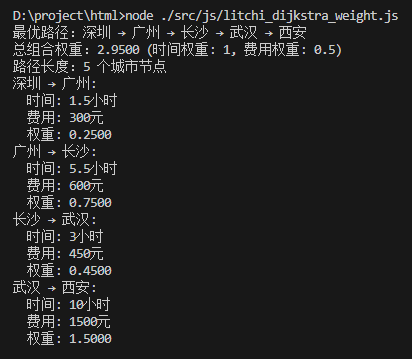
image-20250624103455471
换一下权重试试
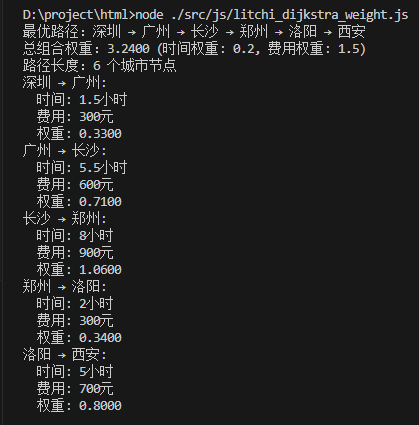
image-20250624103621587
五、可视化
上面使用算法已经算出了最佳路线,但总觉得还差点什么
所以我打算加上图可视化,就用以前工作的时候用到的antv-g6
同时,我还打算加入短路操作,模拟两个城市之间交通瘫痪的情况
不多说,整体代码如下
<!DOCTYPE html>
<html lang="en">
<head>
<meta charset="UTF-8">
<meta name="viewport" content="width=device-width, initial-scale=1.0">
<title>长安的荔枝 - G6可视化</title>
<!-- 引入G6库 -->
<script src="https://gw.alipayobjects.com/os/lib/antv/g6/4.8.15/dist/g6.min.js"></script>
<style>
html {
background: url(https://img0.baidu.com/it/u=1234327337,385347752&fm=253&fmt=auto&app=138&f=JPEG?w=2733&h=800);
background-size: cover;
height: 100%;
}
h1 {
text-align: center;
}
#container {
width: 100%;
height: 800px;
display: flex;
flex-direction: row;
}
#setting-group {
width: 400px;
padding: 10px 20px;
background-color: rgba(25, 25, 25, 0.9);
color: #eee;
border-top-left-radius: 10px;
border-bottom-left-radius: 10px;
}
#graph-container {
width: calc(100% - 400px);
background-color: rgba(64, 64, 64, 0.8);
border-top-right-radius: 10px;
border-bottom-right-radius: 10px;
}
#setting-group .ant-row {
margin-bottom: 20px;
}
.label {
line-height: 34px;
font-size: 16px;
font-weight: bold;
}
.text-plane {
font-size: 16px;
white-space: pre-wrap;
}
</style>
</head>
<body>
<div id="app">
<h1>荔枝运输路线可视化</h1>
<div id="container">
<div id="setting-group">
<a-row>
<a-col :span="5">
<span class="label">耗时权重:</span>
</a-col>
<a-col :span="12">
<a-slider v-model:value="timeWeight" :min="0.1" :max="10" :step="0.1"/>
</a-col>
<a-col :span="4" :offset="1">
<a-input-number v-model:value="timeWeight" :min="0.1" :max="10" :step="0.1"/>
</a-col>
</a-row>
<a-row>
<a-col :span="5">
<span class="label">费用权重:</span>
</a-col>
<a-col :span="12">
<a-slider v-model:value="costWeight" :min="0.1" :max="10" :step="0.1"/>
</a-col>
<a-col :span="4" :offset="1">
<a-input-number v-model:value="costWeight" :min="0.1" :max="10" :step="0.1"/>
</a-col>
</a-row>
<a-row>
<a-col :span="8" :offset="16">
<a-button type="primary" @click="calculatePath">计算并显示路径</a-button>
</a-col>
</a-row>
<a-row class="text-plane">
<span>{{pathResultMsg}}</span>
</a-row>
</div>
<div id="graph-container"></div>
</div>
</div>
<script src="js/vue@3.3.0.js"></script>
<script src="https://unpkg.com/dayjs/dayjs.min.js"></script>
<script src="https://unpkg.com/dayjs/plugin/customParseFormat.js"></script>
<script src="https://unpkg.com/dayjs/plugin/weekday.js"></script>
<script src="https://unpkg.com/dayjs/plugin/localeData.js"></script>
<script src="https://unpkg.com/dayjs/plugin/weekOfYear.js"></script>
<script src="https://unpkg.com/dayjs/plugin/weekYear.js"></script>
<script src="https://unpkg.com/dayjs/plugin/advancedFormat.js"></script>
<script src="https://unpkg.com/dayjs/plugin/quarterOfYear.js"></script>
<script src="js/antd@4.2.1.js"></script>
<script src="js/litchi_dijkstra_weight.js"></script>
<script>
const app = Vue.createApp({
data() {
return {
from: '深圳',
to: '西安',
cityGraph: window.cityGraph,
cityPositions: {
'深圳': [100, 400],
'广州': [300, 200],
'东莞': [250, 550],
'惠州': [450, 650],
'韶关': [550, 150],
'长沙': [400, 400],
'武汉': [700, 550],
'郑州': [750, 250],
'洛阳': [1000, 200],
'西安': [1200, 350]
},
timeWeight: 1,
costWeight: 1,
nodes: [],
edges: [],
brokenEdges: new Set(),
graph: null,
pathResultMsg: "",
}
},
methods: {
initGraph() {
// 初始化节点,边数据
this.initGraphData();
// 初始化G6图
this.graph = new G6.Graph({
container: 'graph-container',
modes: {
default: ['drag-canvas', 'zoom-canvas', 'drag-node']
},
defaultNode: {
size: 40,
style: {
fill: '#2196f3',
stroke: '#fff'
}
},
defaultEdge: {
type: 'line',
style: {
stroke: '#2196f3',
lineWidth: 2,
endArrow: {
path: G6.Arrow.triangle(10, 12, 25),
fill: '#2196f3',
d: 25
}
}
},
fitView: true,
data: {
nodes: this.nodes,
edges: this.edges
}
});
this.graph.render();
// 绑定边事件
this.graph.on('edge:click', (evt) => {
const edge = evt.item;
const edgeId = edge.getModel().id;
const source = edge.getModel().source;
const target = edge.getModel().target;
const edgeInfo = edge.getModel().data;
console.log(edgeInfo);
if (this.brokenEdges.has(edgeId)) {
this.brokenEdges.delete(edgeId);
this.setCityEdge(source, target, edgeInfo);
} else {
this.brokenEdges.add(edgeId);
this.setCityEdge(source, target, null);
}
// 更新边样式
this.graph.updateItem(edge, {
style: {
stroke: this.brokenEdges.has(edgeId) ? '#9e9e9e' : '#2196f3',
opacity: this.brokenEdges.has(edgeId) ? 0.3 : 1
},
labelCfg: {
style: {
fill: this.brokenEdges.has(edgeId) ? '#9e9e9e' : '#fff',
background: {
fill: this.brokenEdges.has(edgeId) ? 'rgba(30, 30, 50, 0.1)' : 'rgba(30, 30, 50, 0.8)',
padding: [2, 4, 2, 4],
radius: 3
}
}
}
});
})
},
initGraphData() {
this.nodes = Object.keys(this.cityPositions).map(city => ({
id: city,
label: city,
x: this.cityPositions[city][0],
y: this.cityPositions[city][1],
type: 'circle',
size: 40,
style: {
fill: city === this.from ? '#4caf50' : city === this.to ? '#f44336' : '#2196f3',
lineWidth: 2,
stroke: '#fff'
},
labelCfg: {
style: {
fill: '#fff',
fontSize: 14,
fontWeight: 'bold'
}
}
}));
const edges = [];
for (const source in this.cityGraph) {
for (const target in this.cityGraph[source]) {
const edgeKey = `${source}-${target}`;
const reverseEdgeKey = `${target}-${source}`;
// 避免重复添加双向边
if (!edges.some(e => e.id === reverseEdgeKey)) {
edges.push({
id: edgeKey,
source: source,
target: target,
label: `${this.cityGraph[source][target].time}小时, ¥${this.cityGraph[source][target].cost}`,
data: this.cityGraph[source][target],
style: {
lineWidth: 2,
stroke: this.brokenEdges.has(edgeKey) ? '#9e9e9e' : '#2196f3',
opacity: this.brokenEdges.has(edgeKey) ? 0.3 : 1,
cursor: 'pointer'
},
labelCfg: {
autoRotate: true,
style: {
fill: this.brokenEdges.has(edgeKey) ? '#9e9e9e' : '#fff',
background: {
fill: 'rgba(30, 30, 50, 0.8)',
padding: [2, 4, 2, 4],
radius: 3
}
}
}
});
}
}
}
this.edges = edges;
},
calculatePath() {
let result = window.dijkstraShortestPath(this.cityGraph, this.from, this.to, this.timeWeight, this.costWeight);
if (result) {
this.pathResultMsg = formatPath(result.path, result.weights, result.allWeight, this.timeWeight, this.costWeight);
this.highlightGraphPath(result);
} else {
this.pathResultMsg = `未找到从${this.from}到${this.to}的路径!`;
}
},
highlightGraphPath(result) {
const path = result.path;
// 更新节点
this.graph.getNodes().forEach(node => {
let city = node.getModel().id;
let fill = city === this.from ? '#4caf50'
: city === this.to ? '#f44336'
: path.includes(city) ? '#ffeb3b' : '#cccfff';
this.graph.updateItem(node, {
style: { fill }
})
});
// 更新边
this.graph.getEdges().forEach(edge => {
const model = edge.getModel();
const source = model.source;
const target = model.target;
let isInPath = false;
for (let i = 0; i < path.length - 1; i++) {
if ((path[i] === source && path[i+1] === target) ||
(path[i] === target && path[i+1] === source)) {
isInPath = true;
break;
}
}
// 更新边样式
let stroke = this.brokenEdges.has(model.id) ? '#9e9e9e' : '#2196f3';
let opacity = this.brokenEdges.has(model.id) ? 0.3 : 1;
let lineWidth = 2;
if (isInPath && !this.brokenEdges.has(model.id)) {
stroke = '#ff9800';
opacity = 1;
lineWidth = 2;
}
this.graph.updateItem(edge, {
style: {
stroke,
opacity,
lineWidth
}
});
})
},
setCityEdge(source, target, edgeInfo) {
let tempEdgeInfo = this.cityGraph[source][target];
// console.log(source, target, edgeInfo);
if (edgeInfo) {
this.cityGraph[source][target] = edgeInfo;
this.cityGraph[target][source] = edgeInfo;
} else {
delete this.cityGraph[source][target];
delete this.cityGraph[target][source];
}
this.cityGraph = {
...this.cityGraph
}
console.log(this.cityGraph);
return tempEdgeInfo;
}
},
mounted() {
this.initGraph();
},
});
app.use(antd);
app.mount("#app");
</script>
</body>
</html>运行就如开头展示的效果一样
result
同时,还支持短路操作,只需要点一个城市的两个边,就能对其进行短路
result
对于耗时与费用的权衡,我在左侧放了滑块控件,用来确认权重
原创声明:本文系作者授权腾讯云开发者社区发表,未经许可,不得转载。
如有侵权,请联系 cloudcommunity@tencent.com 删除。
原创声明:本文系作者授权腾讯云开发者社区发表,未经许可,不得转载。
如有侵权,请联系 cloudcommunity@tencent.com 删除。
评论
登录后参与评论
推荐阅读
目录
腾讯云开发者

Copyright © 2013 - 2026 Tencent Cloud. All Rights Reserved. 腾讯云 版权所有
深圳市腾讯计算机系统有限公司 ICP备案/许可证号:粤B2-20090059 ![]() 粤公网安备44030502008569号
粤公网安备44030502008569号
腾讯云计算(北京)有限责任公司 京ICP证150476号 | 京ICP备11018762号