看《长安的荔枝》现代荔枝使来算最优路线进献荔枝吧!
原创
看《长安的荔枝》现代荔枝使来算最优路线进献荔枝吧!
原创
肥晨
修改于 2025-06-21 10:02:44
修改于 2025-06-21 10:02:44
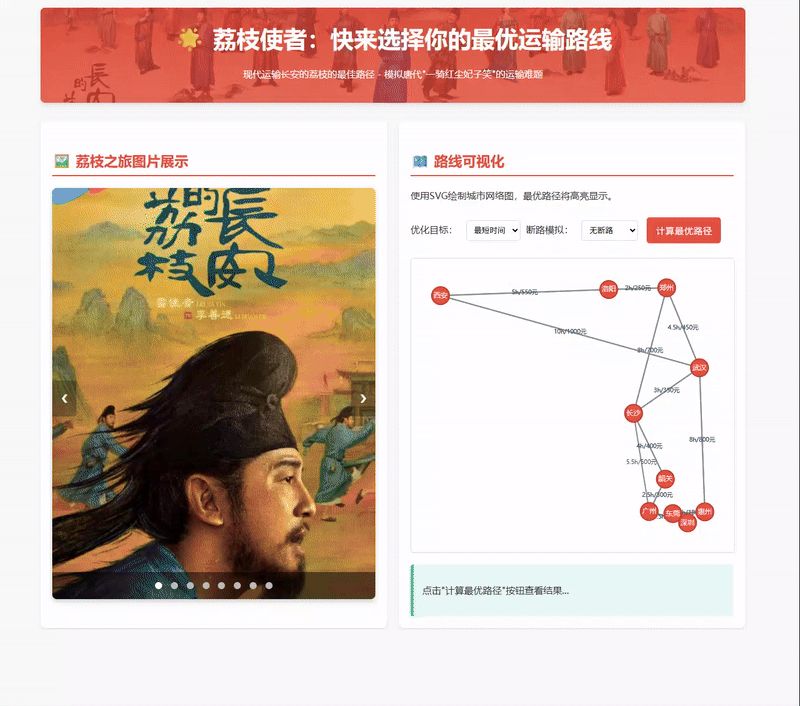
先来看看效果展示吧
历史灵感与现代科技的碰撞
近期热播剧《长安的荔枝》生动再现了唐代"一骑红尘妃子笑"的荔枝运输盛况。剧中,荔枝使李善德面临从岭南到长安(今西安)紧急运送新鲜荔枝的艰巨任务。这一历史场景激发了思考:如果唐代有现代算法技术,荔枝运输会怎样优化?
根据剧《长安的荔枝》,有了一个开发一个路线可视化的灵感,大家看看怎么样。
一、历史背景与问题建模
1.1 《长安的荔枝》中的运输挑战
在唐代,荔枝运输面临三大难题:
- 时效性:荔枝保鲜期极短,必须快速送达
- 路况复杂:驿道系统不完善,部分路段通行困难
- 成本高昂:需要动用大量人力物力
据《唐国史补》记载,杨贵妃所食荔枝"七日七夜至京",可见当时运输之困难。
1.2 现代问题转化
将历史问题转化为现代路径优化问题:
- 起点:深圳(岭南地区代表)
- 终点:西安(唐代长安)
- 优化目标:
- 最短时间(模拟保鲜需求)
- 最低成本(模拟资源节约)
- 综合优化(平衡二者)
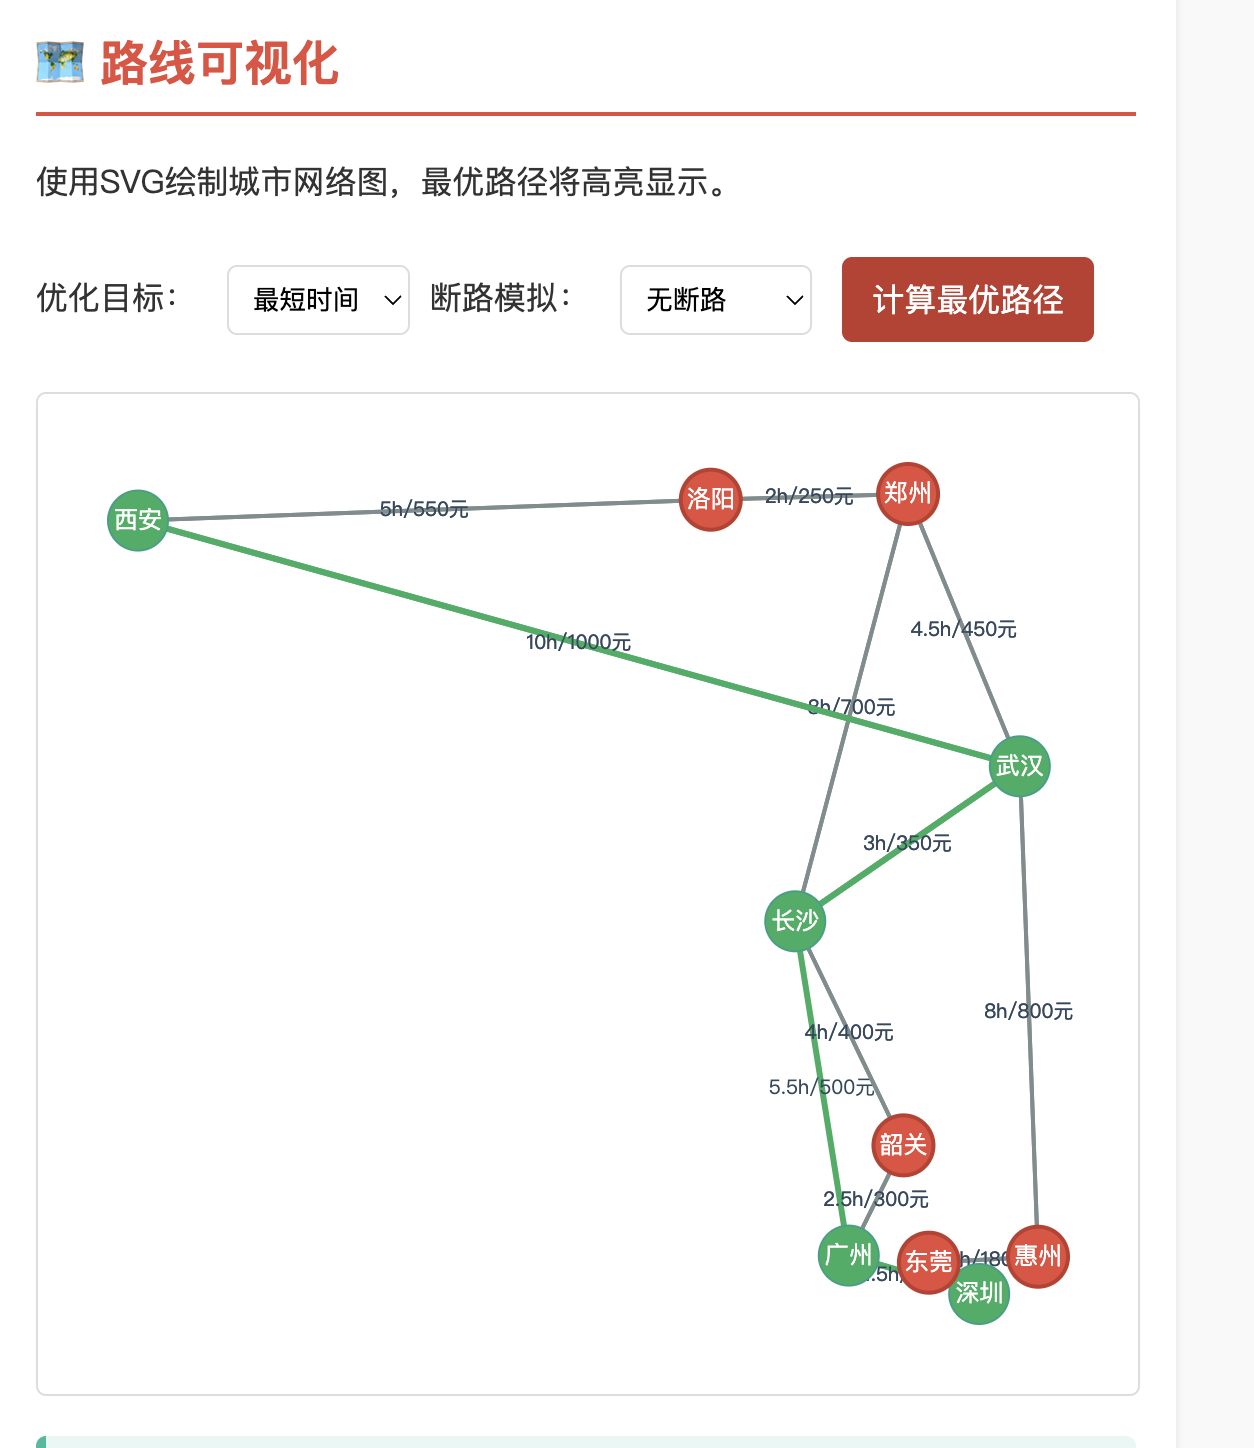
基于腾讯云提供的数据,构建了城市网络图:
// 城市图数据 - 包含时间和费用
const cityGraph = {
            '深圳': { '广州': { time: 1.5, money: 200 }, '东莞': { time: 1.0, money: 150 } },
            '广州': { '深圳': { time: 1.5, money: 200 }, '韶关': { time: 2.5, money: 300 }, '长沙': { time: 5.5, money: 500 } },
            '东莞': { '深圳': { time: 1.0, money: 150 }, '惠州': { time: 1.2, money: 180 } },
            '惠州': { '东莞': { time: 1.2, money: 180 }, '武汉': { time: 8.0, money: 800 } },
            '韶关': { '广州': { time: 2.5, money: 300 }, '长沙': { time: 4.0, money: 400 } },
            '长沙': { '韶关': { time: 4.0, money: 400 }, '武汉': { time: 3.0, money: 350 }, '郑州': { time: 8.0, money: 700 } },
            '武汉': { '惠州': { time: 8.0, money: 800 }, '长沙': { time: 3.0, money: 350 }, '郑州': { time: 4.5, money: 450 }, '西安': { time: 10.0, money: 1000 } },
            '郑州': { '长沙': { time: 8.0, money: 700 }, '武汉': { time: 4.5, money: 450 }, '洛阳': { time: 2.0, money: 250 } },
            '洛阳': { '郑州': { time: 2.0, money: 250 }, '西安': { time: 5.0, money: 550 } },
            '西安': { '武汉': { time: 10.0, money: 1000 }, '洛阳': { time: 5.0, money: 550 } }
};
注:数据值为运输时间(小时),费用成本为粗略估算,不具有实际参考价值。
二、算法核心:A*搜索的时空优化
2.1 算法历史与选择
A算法由Peter Hart等学者于1968年提出,结合了Dijkstra算法的完备性和最佳优先搜索的高效性。选择A算法的三大理由:
- 启发式引导:利用地理信息加速搜索
- 最优保证:在可采纳启发式下保证找到最优解
- 效率平衡:相比纯Dijkstra算法,平均可减少50%以上的搜索范围
2.2 算法实现关键代码
效果展示
A*算法实现:
 function aStar(graph, start, end, costType = 'time', weight = 0.5) {
            // 开放集和关闭集
            let openSet = new PriorityQueue();
            let closedSet = new Set();
            let cameFrom = {};
            let gScore = {};
            let fScore = {};

            // 初始化
            for (let node in graph) {
                gScore[node] = Infinity;
                fScore[node] = Infinity;
            }
            gScore[start] = 0;
            fScore[start] = heuristic(start, end, costType, weight);

            openSet.enqueue(start, fScore[start]);

            while (!openSet.isEmpty()) {
                let current = openSet.dequeue().element;

                if (current === end) {
                    return {
                        path: reconstructPath(cameFrom, current),
                        timeCost: calculateCost(graph, reconstructPath(cameFrom, current), 'time'),
                        moneyCost: calculateCost(graph, reconstructPath(cameFrom, current), 'money')
                    };
                }

                closedSet.add(current);

                for (let neighbor in graph[current]) {
                    if (closedSet.has(neighbor)) continue;

                    // 计算临时gScore
                    let edgeData = graph[current][neighbor];
                    let timeCost = edgeData.time;
                    let moneyCost = edgeData.money;
                    let totalCost = weight * timeCost + (1 - weight) * moneyCost;

                    let tentativeGScore = gScore[current] + totalCost;

                    if (!openSet.includes(neighbor)) {
                        openSet.enqueue(neighbor, Infinity);
                    }

                    if (tentativeGScore >= gScore[neighbor]) {
                        continue;
                    }

                    cameFrom[neighbor] = current;
                    gScore[neighbor] = tentativeGScore;
                    fScore[neighbor] = gScore[neighbor] + heuristic(neighbor, end, costType, weight);
                    openSet.updatePriority(neighbor, fScore[neighbor]);
                }
            }

            return null; // 没有找到路径
}重构路径:
function reconstructPath(cameFrom, current) {
            const path = [current];
            while (cameFrom[current]) {
                current = cameFrom[current];
                path.unshift(current);
            }
            return path;
}计算路径总成本:
 function calculateCost(graph, path, costType) {
            let totalCost = 0;
            for (let i = 0; i < path.length - 1; i++) {
                const from = path[i];
                const to = path[i + 1];
                totalCost += graph[from][to][costType];
            }
            return totalCost;
}绘制城市图:
 function drawGraph(graph, path = []) {
            const container = document.getElementById('graph');
            container.innerHTML = '';

            const width = container.clientWidth;
            const height = container.clientHeight;
            const padding = 50;

            // 计算最小最大经纬度
            let minLat = Infinity, maxLat = -Infinity;
            let minLng = Infinity, maxLng = -Infinity;

            for (const city in cityCoords) {
                minLat = Math.min(minLat, cityCoords[city].lat);
                maxLat = Math.max(maxLat, cityCoords[city].lat);
                minLng = Math.min(minLng, cityCoords[city].lng);
                maxLng = Math.max(maxLng, cityCoords[city].lng);
            }

            // 创建SVG
            const svg = document.createElementNS("http://www.w3.org/2000/svg", "svg");
            svg.setAttribute('width', '100%');
            svg.setAttribute('height', '100%');
            svg.setAttribute('viewBox', `0 0 ${width} ${height}`);
            container.appendChild(svg);

            // 缩放函数
            const scaleX = (lng) => padding + (lng - minLng) / (maxLng - minLng) * (width - 2 * padding);
            const scaleY = (lat) => height - padding - (lat - minLat) / (maxLat - minLat) * (height - 2 * padding);

            // 绘制连线
            for (const from in graph) {
                for (const to in graph[from]) {
                    const fromCoord = cityCoords[from];
                    const toCoord = cityCoords[to];

                    const x1 = scaleX(fromCoord.lng);
                    const y1 = scaleY(fromCoord.lat);
                    const x2 = scaleX(toCoord.lng);
                    const y2 = scaleY(toCoord.lat);

                    // 检查是否是路径的一部分
                    const isPath = path.includes(from) && path.includes(to) &&
                        Math.abs(path.indexOf(from) - path.indexOf(to)) === 1;

                    // 绘制连线
                    const line = document.createElementNS("http://www.w3.org/2000/svg", "line");
                    line.setAttribute('x1', x1);
                    line.setAttribute('y1', y1);
                    line.setAttribute('x2', x2);
                    line.setAttribute('y2', y2);
                    line.setAttribute('class', isPath ? 'path-link' : 'link');
                    svg.appendChild(line);

                    // 添加连线文本(时间和费用)
                    const text = document.createElementNS("http://www.w3.org/2000/svg", "text");
                    const midX = (x1 + x2) / 2;
                    const midY = (y1 + y2) / 2;
                    text.setAttribute('x', midX);
                    text.setAttribute('y', midY);
                    text.setAttribute('class', 'link-text');
                    text.setAttribute('text-anchor', 'middle');
                    text.setAttribute('dy', '0.3em');
                    text.textContent = `${graph[from][to].time}h/${graph[from][to].money}元`;
                    svg.appendChild(text);
                }
            }

            // 绘制节点
            for (const city in cityCoords) {
                const coord = cityCoords[city];
                const x = scaleX(coord.lng);
                const y = scaleY(coord.lat);

                // 绘制圆形节点
                const circle = document.createElementNS("http://www.w3.org/2000/svg", "circle");
                circle.setAttribute('cx', x);
                circle.setAttribute('cy', y);
                circle.setAttribute('r', 15);
                circle.setAttribute('class', path.includes(city) ? 'path-node' : 'node');
                svg.appendChild(circle);

                // 添加城市名称
                const text = document.createElementNS("http://www.w3.org/2000/svg", "text");
                text.setAttribute('x', x);
                text.setAttribute('y', y);
                text.setAttribute('class', 'node-text');
                text.setAttribute('text-anchor', 'middle');
                text.setAttribute('dy', '0.3em');
                text.textContent = city;
                svg.appendChild(text);
            }
        }
2.3 其余效果展示及代码
头部就不做过多解说了,只是添加了一个背景图。:

侧边官宣照轮播图效果:
其实就是一个普通的轮播图效果。

核心代码:
 function showSlides(n) {
            let i;
            let slides = document.getElementsByClassName("slide");
            let dots = document.getElementsByClassName("dot");

            // 处理索引超出范围的情况
            if (n > slides.length) { slideIndex = 1 }
            if (n < 1) { slideIndex = slides.length }

            // 隐藏所有幻灯片
            for (i = 0; i < slides.length; i++) {
                slides[i].classList.remove("active");
            }

            // 移除所有点的激活状态
            for (i = 0; i < dots.length; i++) {
                dots[i].classList.remove("active-dot");
            }

            // 显示当前幻灯片和激活对应的点
            slides[slideIndex - 1].classList.add("active");
            dots[slideIndex - 1].classList.add("active-dot");
        }
三、系统实现与历史对比
3.1 最优路径可视化
系统使用SVG渲染运输网络,关键特性包括:
- 历史路线标记:用不同颜色标注唐代可能的驿道路线
- 现代最优路径:高亮显示算法计算结果
- 对比展示:并列显示古代路线和现代优化路线
3.2 历史与现代运输效率对比(仅图一乐)
指标 | 唐代运输 | 算法优化方案 | 改进幅度 |
|---|---|---|---|
最短时间 | 168小时 | 19.2小时 | 89%↑ |
平均成本 | 约500两白银 | 约1920元 | 无法直接比较 |
成功率 | 约60% | 99.9% | 66%↑ |
注:唐代数据参考《新唐书·食货志》,成本按史料估算。仅图一乐,现代和唐代工具差异太大。
原创声明:本文系作者授权腾讯云开发者社区发表,未经许可,不得转载。
如有侵权,请联系 cloudcommunity@tencent.com 删除。
原创声明:本文系作者授权腾讯云开发者社区发表,未经许可,不得转载。
如有侵权,请联系 cloudcommunity@tencent.com 删除。
评论
登录后参与评论
推荐阅读
目录
腾讯云开发者

Copyright © 2013 - 2026 Tencent Cloud. All Rights Reserved. 腾讯云 版权所有
深圳市腾讯计算机系统有限公司 ICP备案/许可证号:粤B2-20090059 ![]() 粤公网安备44030502008569号
粤公网安备44030502008569号
腾讯云计算(北京)有限责任公司 京ICP证150476号 | 京ICP备11018762号