Google Earth Engine——北纬85度和南纬60度之间所有地区到最近的人口密集区的迁移时间数据集

Google Earth Engine——北纬85度和南纬60度之间所有地区到最近的人口密集区的迁移时间数据集

此星光明
发布于 2024-02-02 10:02:36
发布于 2024-02-02 10:02:36
This global accessibility map enumerates land-based travel time to the nearest densely-populated area for all areas between 85 degrees north and 60 degrees south for a nominal year 2015. Densely-populated areas are defined as contiguous areas with 1,500 or more inhabitants per square kilometer or a majority of built-up land cover types coincident with a population centre of at least 50,000 inhabitants. This map was produced through a collaboration between the University of Oxford Malaria Atlas Project (MAP), Google, the European Union Joint Research Centre (JRC), and the University of Twente, Netherlands. The underlying datasets used to produce the map include roads (comprising the first ever global-scale use of Open Street Map and Google roads datasets), railways, rivers, lakes, oceans, topographic conditions (slope and elevation), landcover types, and national borders. These datasets were each allocated a speed or speeds of travel in terms of time to cross each pixel of that type. The datasets were then combined to produce a “friction surface”, a map where every pixel is allocated a nominal overall speed of travel based on the types occurring within that pixel. Least-cost-path algorithms (running in Google Earth Engine and, for high-latitude areas, in R) were used in conjunction with this friction surface to calculate the time of travel from all locations to the nearest city (by travel time). Cities were determined using the high-density-cover product created by the Global Human Settlement Project. Each pixel in the resultant accessibility map thus represents the modeled shortest time from that location to a city.
Source dataset credits are as described in the accompanying paper.
这张全球可及性地图列举了北纬85度和南纬60度之间所有地区到最近的人口密集区的陆路旅行时间,以2015年为名义。人口稠密地区被定义为每平方公里有1,500名或更多居民的连续地区,或大多数建筑土地覆盖类型与至少50,000名居民的人口中心相吻合。该地图是由牛津大学疟疾地图集项目(MAP)、谷歌、欧盟联合研究中心(JRC)和荷兰特文特大学合作制作的。用于制作该地图的基础数据集包括道路(包括首次在全球范围内使用开放街道地图和谷歌道路数据集)、铁路、河流、湖泊、海洋、地形条件(坡度和海拔)、土地覆盖类型以及国家边界。这些数据集都被分配了一个或多个旅行速度,即穿越该类型的每个像素的时间。然后,这些数据集被合并以产生一个 "摩擦面",在这张地图上,每个像素都被分配了一个基于该像素内出现的类型的名义总旅行速度。最小成本路径算法(在谷歌地球引擎中运行,对于高纬度地区,在R中运行)与该摩擦面结合使用,以计算从所有地点到最近的城市的旅行时间(按旅行时间)。城市是使用全球人类住区项目创建的高密度覆盖产品来确定的。因此,由此产生的可及性地图中的每个像素代表了从该地点到城市的模拟最短时间。
源数据集的功劳在随附的文件中描述。
Dataset Availability
2015-01-01T00:00:00 - 2016-01-01T00:00:00
Dataset Provider
Collection Snippet
ee.Image("Oxford/MAP/accessibility_to_cities_2015_v1_0")
Bands Table
Name | Description | Min | Max | Resolution | Units |
|---|---|---|---|---|---|
accessibility | Travel time to the nearest densely-populated area. | 0 | 41556 | 927.67 meters | minutes |
数据引用:
D.J. Weiss, A. Nelson, H.S. Gibson, W. Temperley, S. Peedell, A. Lieber, M. Hancher, E. Poyart, S. Belchior, N. Fullman, B. Mappin, U. Dalrymple, J. Rozier, T.C.D. Lucas, R.E. Howes, L.S. Tusting, S.Y. Kang, E. Cameron, D. Bisanzio, K.E. Battle, S. Bhatt, and P.W. Gething. A global map of travel time to cities to assess inequalities in accessibility in 2015. Nature (2018). (doi:10.1038/nature25181)[https://doi.org/10.1038/nature25181]
代码:
var dataset = ee.Image('Oxford/MAP/accessibility_to_cities_2015_v1_0');
var accessibility = dataset.select('accessibility');
var accessibilityVis = {
  min: 0.0,
  max: 41556.0,
  gamma: 4.0,
};
Map.setCenter(18.98, 6.66, 2);
Map.addLayer(accessibility, accessibilityVis, 'Accessibility');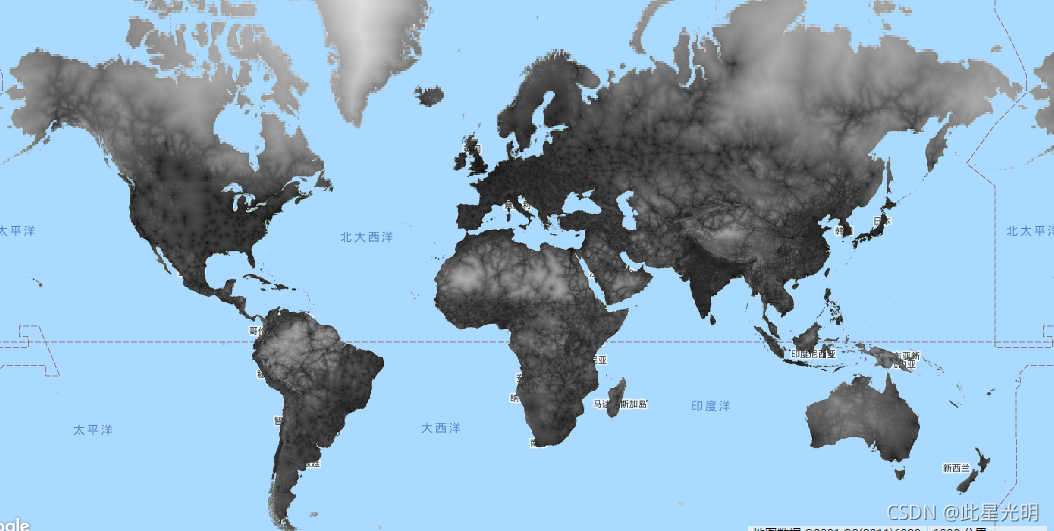
本文参与 腾讯云自媒体同步曝光计划,分享自作者个人站点/博客。
原始发表:2021-10-05,如有侵权请联系 cloudcommunity@tencent.com 删除
评论
登录后参与评论
推荐阅读
腾讯云开发者

Copyright © 2013 - 2026 Tencent Cloud. All Rights Reserved. 腾讯云 版权所有
深圳市腾讯计算机系统有限公司 ICP备案/许可证号:粤B2-20090059 ![]() 粤公网安备44030502008569号
粤公网安备44030502008569号
腾讯云计算(北京)有限责任公司 京ICP证150476号 | 京ICP备11018762号